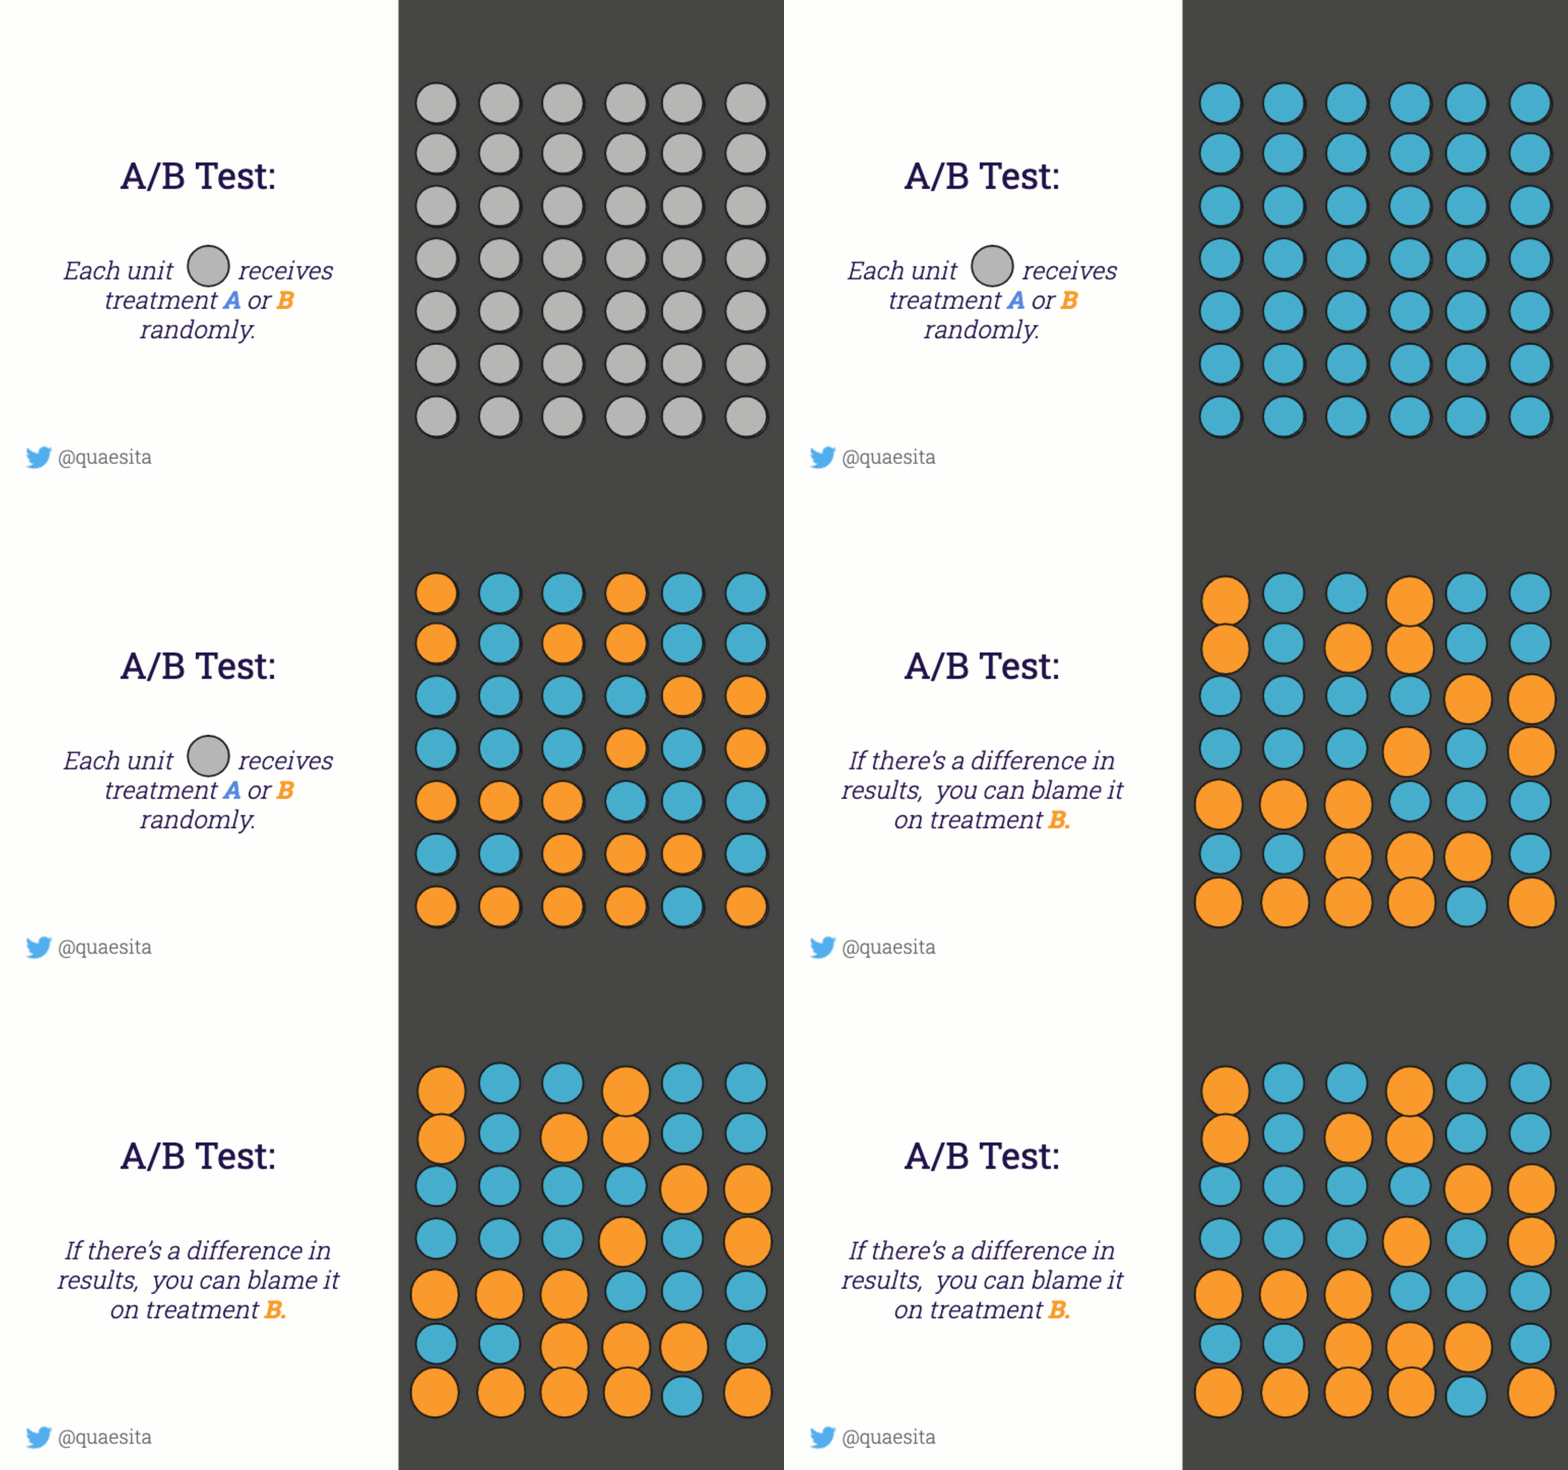
**In a nutshell: **A/B testing is all about studying causality by creating believable clones — two identical items (or, more typically, two statistically identical groups) — and then seeing the effects of treating them differently.

When I say two identical items, I mean even more identical than this. The key is to find “believable clones” … or let randomization plus large sample sizes create them for you. Image: SOURCE.
Scientific, controlled experiments are incredible tools; they give you permission to talk about what causes what. Without them, all you have is correlation, which is often unhelpful for decision-making.
Experiments are your license to use the word “because” in polite conversation.
Unfortunately, it’s fairly common to see folks deluding themselves about the quality of their inferences, claiming the benefits of scientific experimentation without having done a proper experiment. When there’s uncertainty, what you’re doing doesn’t count as an experiment unless all three of these components are present:
- Different treatments applied
- Treatments randomly assigned
- **Scientific hypothesis tested **(see my explanation here)
If you need a refresher on this topic and the logic around it, check out my article Are you guilty of using the word “experiment” incorrectly?
Why do experiments work?
To understand why experiments work as tools for making inferences about cause-and-effect, take a look at the logic behind one of the simplest experiments you can do: the A/B test.
Short explanation
If you don’t feel like reading a detailed example, take a look at this GIF and then skip to the final section (“The secret sauce is randomization”):

Long explanation
If you prefer a thorough example, I’ve got you covered.
Imagine that your company has had a grey logo for a few years. Now that all your competitors have grey logos too (imitation is the sincerest form of flattery), your execs insist on rebranding to a brighter color… but which one?

The logo your users see is grey, but that’s about to change.
After a careful assessment of what’s practical given your company’s website color scheme, your design team identifies the only two feasible candidates: blue and orange.
The CEO’s favorite color is blue, so she picks approving blue as the default action. In other words, she’s saying that if there’s no further information, she’s happy to err on the side of blue. Luckily for you, she’s a strong data-driven leader who is willing to allow data to change her mind to orange.
In order to switch to the alternative action of approving an orange logo, the CEO requires evidence that an orange logo causes your current user population to click more (relative to blue) on specific parts of your website.
You’re the senior data scientist at your company, so your ears prick up. You immediately identify that your CEO’s approach to decision-making fits the framework from frequentist statistics_. _After listening to her carefully, you confirm that her null and alternative hypotheses have to do with matters of cause-and-effect. That means you need to do an experiment! Summarizing what she tells you:
Default action: Approve blue logo.
Alternative action: Approve orange logo.
Null hypothesis: Orange logo does not cause at least 10% more clicking than blue logo.
Alternative hypothesis: Orange logo does cause at least 10% more clicking than blue logo.
#statistics #technology #towards-data-science #data-science #analytics #data analytic