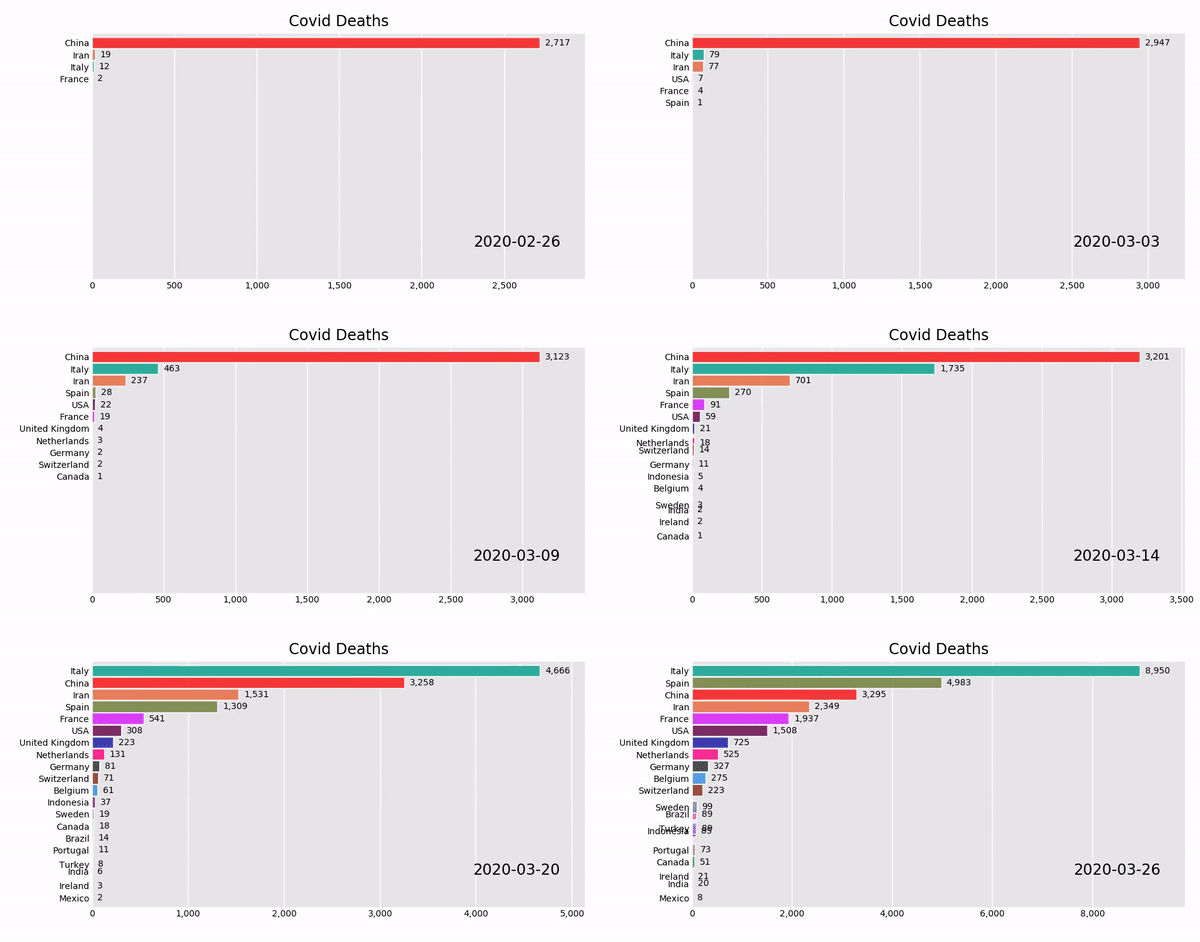
One of the more popular data visualizations right now is the animated bar chart, in which the bars look like they are racing each other. To create your own bar chart race is surprisingly easy and does not take long to create.
You will need to install two libraries if you do not already have them. I use homebrew and it makes libraries very easy to install. If you do not already have homebrew, I recommend you install that before continuing. In your terminal, you need to use the code: brew install ffmpeg. This is the software that will encode your data to be used in the animation.
#data-visualization #data-analysis #bar-chart-race #python

2.45 GEEK