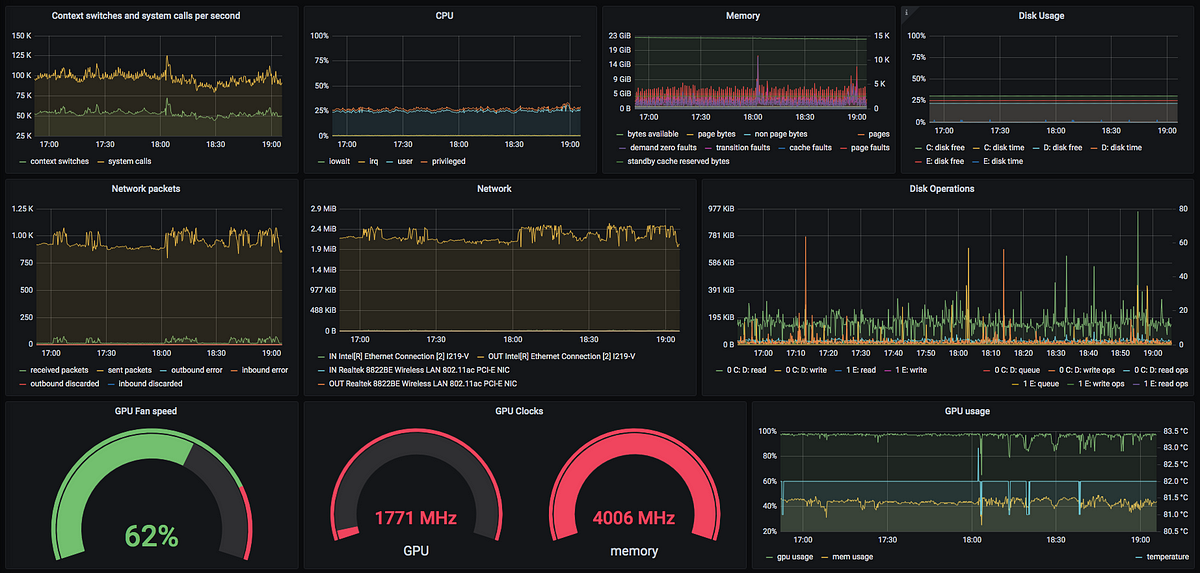
TIG = Telegraf, InfluxDB, Grafana. Audience: developers, nerds, devops beginners…
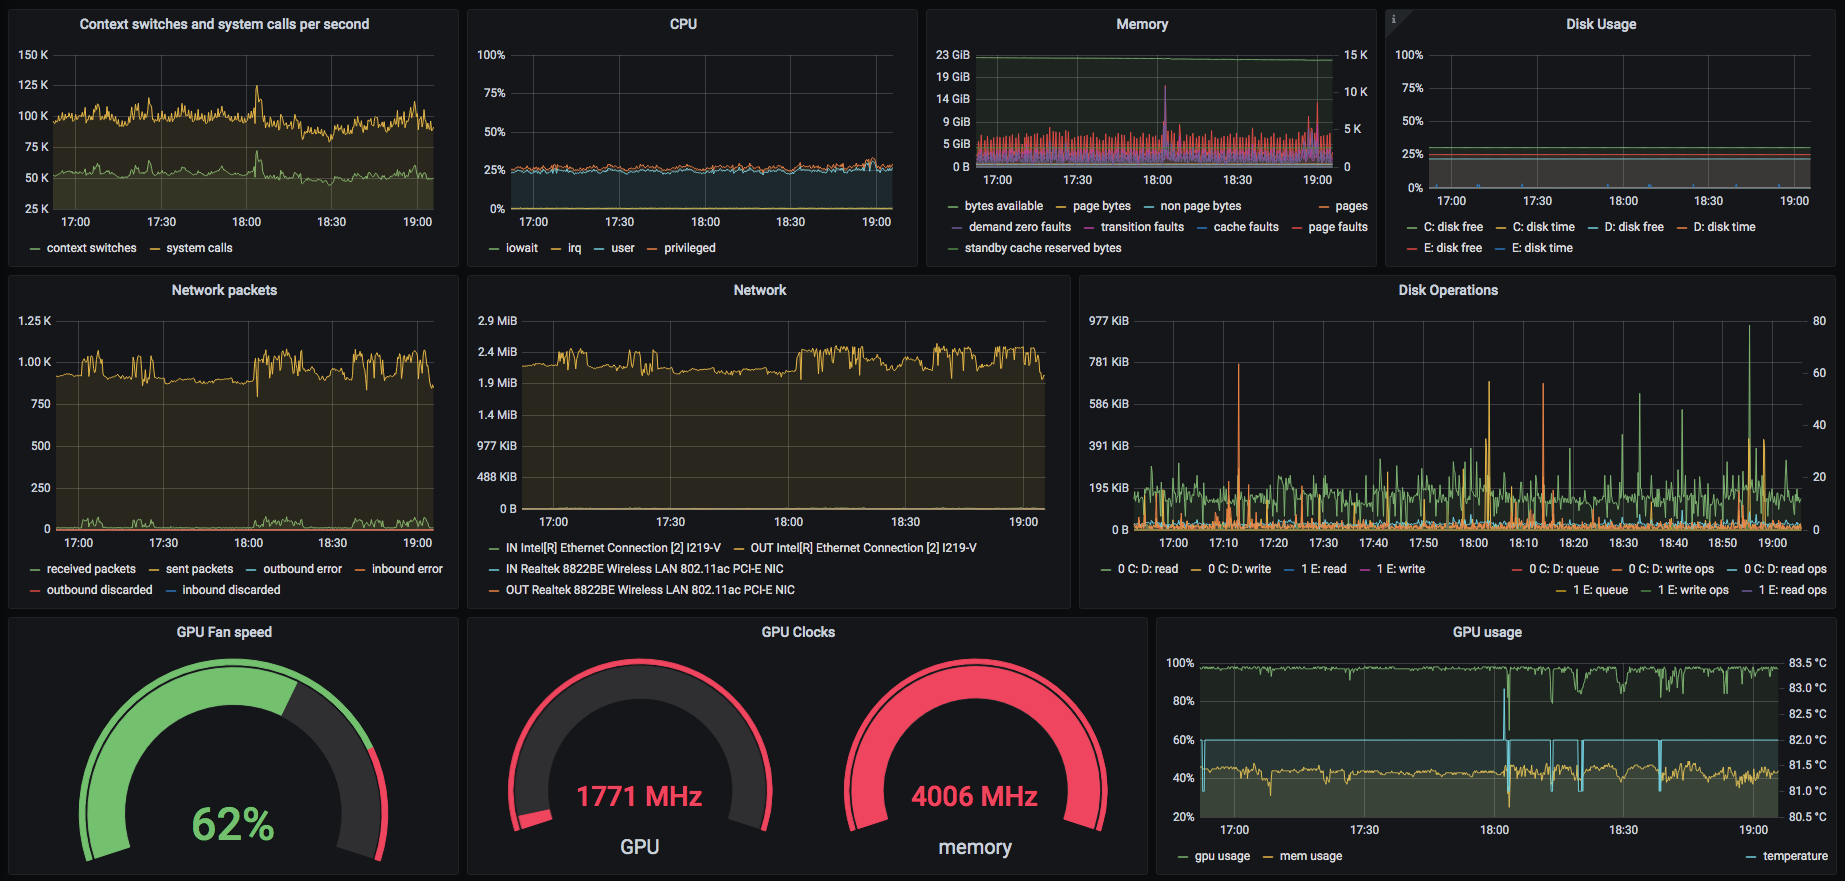
Windows 10 machine while running a game
Monitor Your Own Host Within 15 Minutes
(This story/howto/tutorial assumes you have basic knowledge of linux, the command line and how computers work)
TIG
You may have heard of the “TICK” stack: Telegraf, InfluxDB, Chronograf, Kapacitor. I heavily use Telegraf and InfluxDB, but as visualization frontend, Grafana has become the standard in the environments I work in. Kapacitor can still be used alongside for specific purposes. For this article it’s not needed.
Quite a few years ago — out of curiosity and desire to learn and grow — I started playing with Telegraf and InfluxDB. I got hold of a few older machines (dual cores) on which I installed linux for my two kids. And since I wanted to know more about monitoring, I decided to monitor them (the linux machines ofc!) with Telegraf (a small data collection tool written in golang).
So before we can monitor anything we need to setup the target database and the frontend to see something.
Setup InfluxDB And Grafana
Since we want to focus more on gathering data, we’ll do this real quick.
Take the below docker-compose.yml file and launch it on a host of your preference. For playing around with it, I recommend launching it on your local machine. If you have a dedicated or virtual linux box, that will do fine too.
macOS Prerequisites:
- install homebrew : https://brew.sh/
- install docker :
brew cask install docker
Linux Prerequisites:
- install docker : https://docs.docker.com/get-docker/
Windows Prerequisites:
- install docker : https://docs.docker.com/get-docker/
Docker Compose
Download the following and save it as docker-compose.yml file in a new directory.
## using version 2 because of https://docs.docker.com/compose/compose-file/#resources
	version: "2.4"
	services:
	  telegraf:
	    image: drpsychick/telegraf
	    restart: always
	    environment:
	      HOST_PROC: /rootfs/proc
	      HOST_SYS: /rootfs/sys
	      HOST_ETC: /rootfs/etc
	      TEL_AGENT_HOSTNAME: hostname = "myhostname"
	      TEL_OUTPUTS_INFLUXDB_0: "[[outputs.influxdb]]"
	      TEL_OUTPUTS_INFLUXDB_URLS: urls = ["http://localhost:8086"]
	      TEL_INPUTS_KERNEL_0: "[[inputs.kernel]]"
	      TEL_INPUTS_MEM_0: "[[inputs.mem]]"
	      TEL_INPUTS_SWAP_0: "[[inputs.swap]]"
	      TEL_INPUTS_PROCESSES_0: "[[inputs.processes]]"
	      TEL_INPUTS_SYSTEM_0: "[[inputs.system]]"
	      TEL_INPUTS_DISK_0: "[[inputs.disk]]"
	      TEL_INPUTS_DISKIO_0: "[[inputs.diskio]]"
	      TEL_INPUTS_NET_0: "[[inputs.net]]"
	      TEL_INPUTS_NETSTAT_0: "[[inputs.netstat]]"
	    volumes:
	      - "/proc:/rootfs/proc:ro"
	      - "/sys:/rootfs/sys:ro"
	      - "/etc:/rootfs/etc:ro"
	      - "/var/run/docker.sock:/var/run/docker.sock:ro"
	    cpu_percent: 1
	    mem_limit: 50m
	    network_mode: "host"
	  influxdb:
	    image: drpsychick/influxdb
	    restart: always
	    environment:
	      IFX_GLOBAL: reporting-disabled = true
	    ports:
	      - 8086:8086
	      - 8089:8089/udp
	    volumes:
	      - "influxdb:/var/lib/influxdb"
	    cpu_percent: 50
	    mem_limit: 1g
	    networks:
	      - monitoring
	  grafana:
	    image: grafana/grafana
	    restart: always
	    #environment:
	      #GF_INSTALL_PLUGINS: ## plugins to install
	    ports:
	      - 3000:3000
	    volumes:
	      - "grafana:/var/lib/grafana"
	    cpu_percent: 1
	    mem_limit: 200m
	    networks:
	      - monitoring

	networks:
	  monitoring:

	volumes:
	  influxdb:
	  grafana:
#monitoring #devops #influxdb #grafana #docker