Data processing and transformation is an iterative process and in a way, it can never be ‘perfect’. Because as we gain more understanding on the dataset, such as the inner relationships between target variable and features, or the business context, we think of new ways to deal with them. Recently I started working on media mix models and some predictive models utilizing multiple linear regression. In this post, I will introduce the thought process and different ways to deal with variables for modeling purpose.
I will use King County house price data set (a modified version for more fun) as an example.
Let’s import libraries and look at the data first!
import pandas as pd
import numpy as np
import matplotlib.pyplot as plt
import seaborn as sns
import scipy.stats as stats
% matplotlib inline
df = pd.read_csv(“kc_house_data.csv”)
df.head()
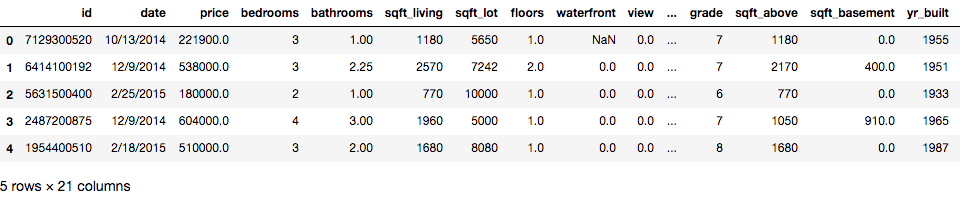
Image by Author
Identify missing values, and obvious incorrect data types.
df.info()

<class 'pandas.core.frame.DataFrame'>
RangeIndex: 21597 entries, 0 to 21596
Data columns (total 21 columns):
id               21597 non-null int64
date             21597 non-null object
price            21597 non-null float64
bedrooms         21597 non-null int64
bathrooms        21597 non-null float64
sqft_living      21597 non-null int64
sqft_lot         21597 non-null int64
floors           21597 non-null float64
waterfront       19221 non-null float64
view             21534 non-null float64
condition        21597 non-null int64
grade            21597 non-null int64
sqft_above       21597 non-null int64
sqft_basement    21597 non-null object
yr_built         21597 non-null int64
yr_renovated     17755 non-null float64
zipcode          21597 non-null int64
lat              21597 non-null float64
long             21597 non-null float64
sqft_living15    21597 non-null int64
sqft_lot15       21597 non-null int64
dtypes: float64(8), int64(11), object(2)
memory usage: 3.5+ MB
#data-science #python #linear-regression