Exploratory data visualization allows us to get an idea of the data, before starting any modeling. Usually scatter plot is a good choice to visualize data with numerical features which allows us to see relationships/ patterns within the data.
The challenge starts when the data set includes Categorical variables (e.g., Country, Gender, Race). How do we visualize such a data set to understand patterns?
The answer lies in embeddings, which is a vector representation of textual data. We can use Embedding layer in keras or gensim Word2Vec module to get the embeddings. In this article, I have visualized a set of multi dimensional categorical data using Altair library in Jupyter notebook.
The data set can be downloaded from UCI Machine Learning Repository. It was donated by Ron Kohavi and Barry Becker, after being published in the article “Scaling Up the Accuracy of Naive-Bayes Classifiers: A Decision-Tree Hybrid”. The data presented below is a cleaned version with the removal of 'fnlwgt' feature and records with missing or ill-formatted entries. Below are first few rows of the data set.
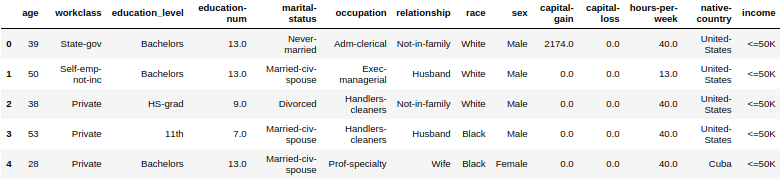
Figure 1: Top rows of data set
There are 8 categorical features in the data set —** workclass, education_level, marital-status, occupation, relationship, race, sex, native-country**. In order to create training data for Word2Vec, I created a new column, which holds an array of all categorical values for the record. For example, the new column for row 0 above would hold [‘State-gov’, ‘Bachelors’, ‘Never-married’, ‘Adm-clerical’, ‘Not-in-family’, ‘White’, ‘Male’, ‘United-States’]. Then I created a 32 dimension categorical embeddings, by passing the values of newly created column as training data to Word2Vec model. I appended the numerical features to the embeddings and then reduced the dimensions using t-SNE. All code and instructions can be accessed in my GitHub repository.
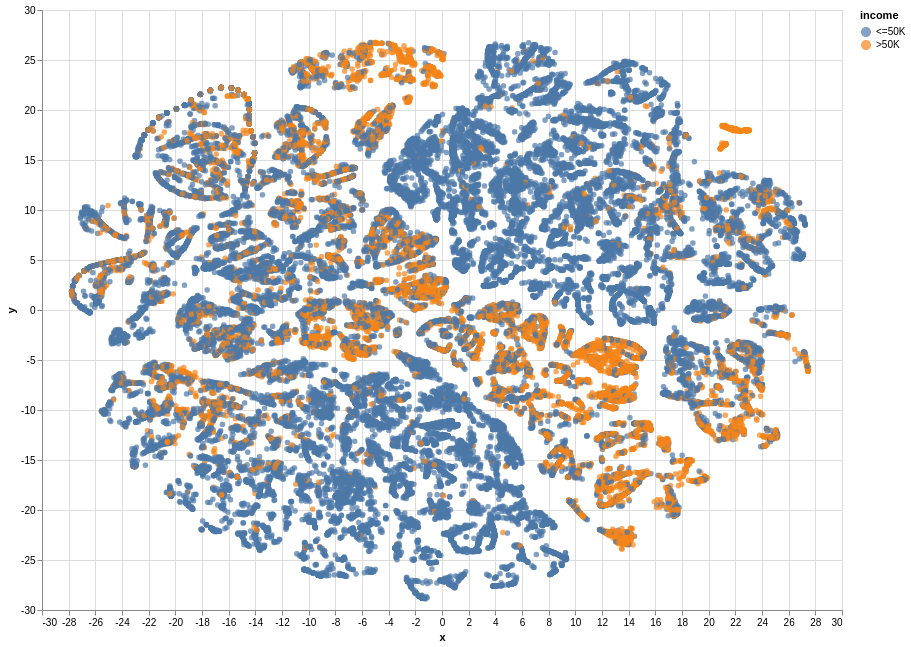
After performing the steps mentioned above, I was able to visualize the data set with 8 categorical variables in a scatter plot. By hovering over a data point, the values for different features appear as a tooltip.
#data-visualization #embedding #categorical-variable #data-science #word2vec #data analysis