Introduction :
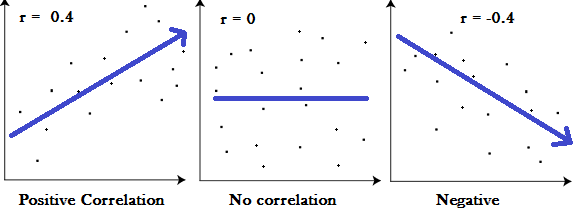
**Correlation **is a statistical measure that indicates the extent to which two or more variables fluctuate together. **Positive Correlation **indicates the extent to which those variable increase or decrease in parallel; **Negative Correlation **indicates the extent to which one variable increases as the other decreases.
Correlation Coefficient :
- A correlation coefficient is a way to put a value to the relationship.
- Correlation Coefficient has a value between** -1 and 1**
- A “0” means there is no relationship between the variables at all.
- While **-1 or 1 **means that there is a perfect negative or positive correlation.
Example :
Regression Analysis :
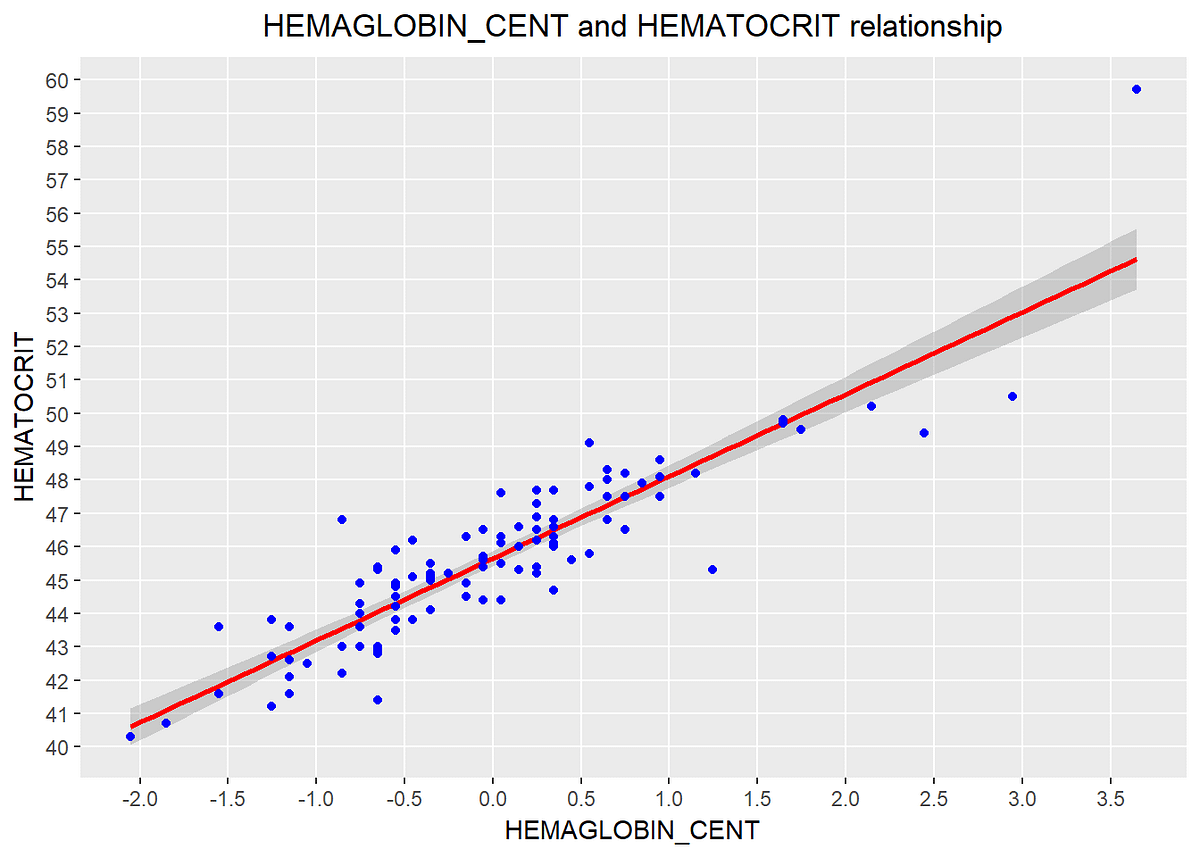
It is a Statistical method To determine whether there is a relationship between two variables.
Response variable and the explanatory variable are continuous variables (i.e. real numbers with decimal places — things like heights, weights, volumes, or temperatures).
Definition:
To predict the value of an outcome variable Y based on one or more input predictor variables X.
Aim: To establish a linear relationship (a mathematical formula) between the predictor variable(s) and the response variable, so that, we can use this formula to estimate the value of the response Y, when only the predictors (Xs) values are known.
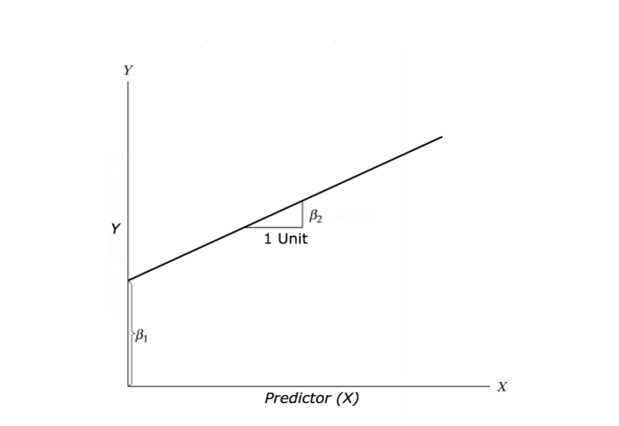
Y = β1 + β2X + ε
• _β_1 is the intercept and _β_2 is the slope.
- Collectively, they are called regression coefficients.
- _ε _is the error term, the part of _Y _the regression model is unable to explain.
#regression-analysis #correlation #r-programming #ggplot2 #linear-regression #data analysis