Introduction
Vandelay Industries has collected some data about people that visit their online store. The data includes basic information about shoppers such as their country, age, how many pages they visited during a session, if they are a new or returning user, which marketing channel they entered the site through, and whether or not they made a purchase (converted).
Goal
Given this information, our task is to predict conversion rate, and make recommendations to the product team and the marketing team on ways to improve conversion rate.
Exploratory Data Analysis
The data set has been pre-cleaned and does not contain missing values. So we can dive right into EDA and plotting the feature distributions.
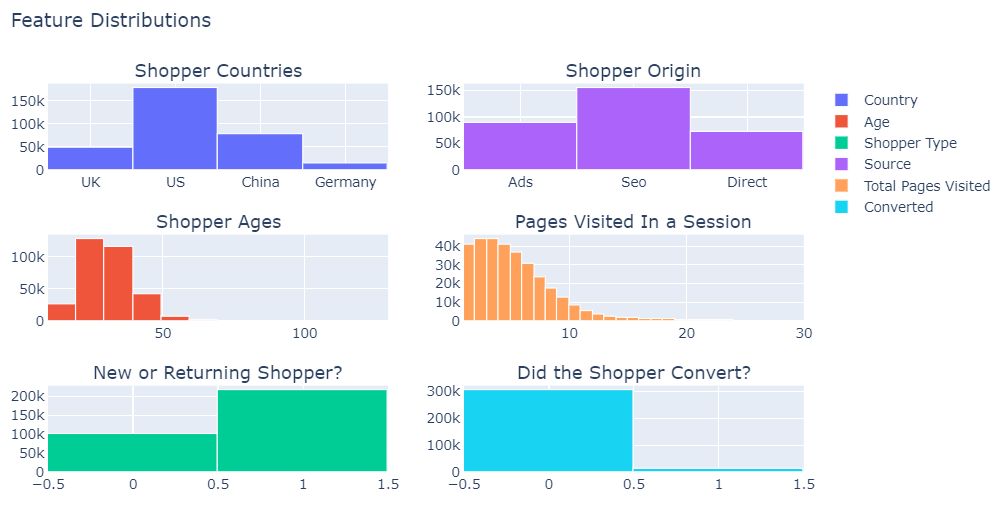
Image: Deandra Alvear
By plotting the distribution of each feature, we gain several new insights about the shoppers that visit Vandelay Industries’s website.
- **More than half the shoppers in the data set are located in the US: **Vandelay Industries is most likely a US-based company.
2. **age** **seems to be between 17-123: **Upon closer examination, there are two shoppers between 100 and 123 years old. There’s no way to verify these records, but in a data set with 300,000+ shoppers, it is unlikely these two records will affect our results, so I’ll keep them in.
3. **There is twice as many new shoppers than returning shoppers: **Vandelay Industries is doing well at getting shoppers to return to its website.
4. Most shoppers enter the site by clicking a search engine result: this is opposed to them entering via an advertisement or directly typing in the website address.
5. Most shoppers visit less than 10 pages during a session
6. **The classes in the **converted** column are imbalanced: **a quick calculation shows the site’s current conversion rate is around 3%. A quick search for average conversion rate for an e-commerce platform is 1–2%, so the company isn’t performing poorly by any means. This will be our target attribute.
At this point I know quite a bit about this data set; now I can explore the relationships between the features. Since there is a mix of numerical and categorical features, some feature engineering will need to be done. This step is outside the scope of this article, but can be found in this Jupyter Notebook.

It appears that none of the columns are correlated to each other except total_pages_visited and converted, and they seem to be positively correlated. This suggests that as shoppers view more pages, the possibility of them converting increases. Conversely, a negative correlation would imply that as shoppers visit more pages in a session, the possibility of them converting decreases. Typically we see this when a feature on a website isn’t functioning correctly.
Now I’ll implement a baseline model to predict conversion rate.
#business-analytics #decision-tree #machine-learning #conversion-rate #data-science #data analytic