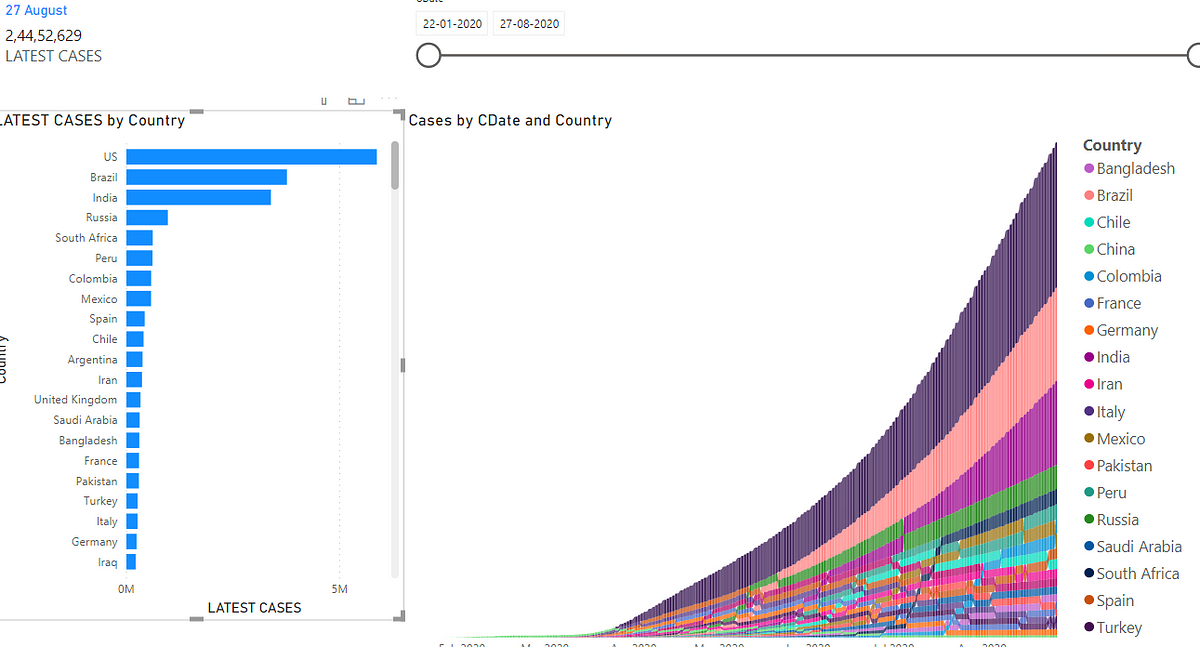
Let’s not start this with rant of Covid but how Data is becoming the new money. We have plethora of data but that’s of no use if we are not modelling it in a right way, there is innumerable of hidden information lying in that excel sheets.
“Information is the oil of the 21st century, and analytics is the combustion engine”
I will here explain how to create your own Covid-19 Live Dashboard with all steps. If you find it helpful then help others by sharing it.
On Power BI itself we will do the cleaning and importing of the data with use of DataFlow function.
1- Sign in to your PowerBI account and click on create WorkSpace and name it accordingly. For using Dataflow you might require Pro version, students can have it with their student id’s and rest can enjoy 60days free trial.
#data-visualization #power-bi #covid19 #data-analysis #data-science
