Tiny and Simple Javascript Graphing Library
picograph.js
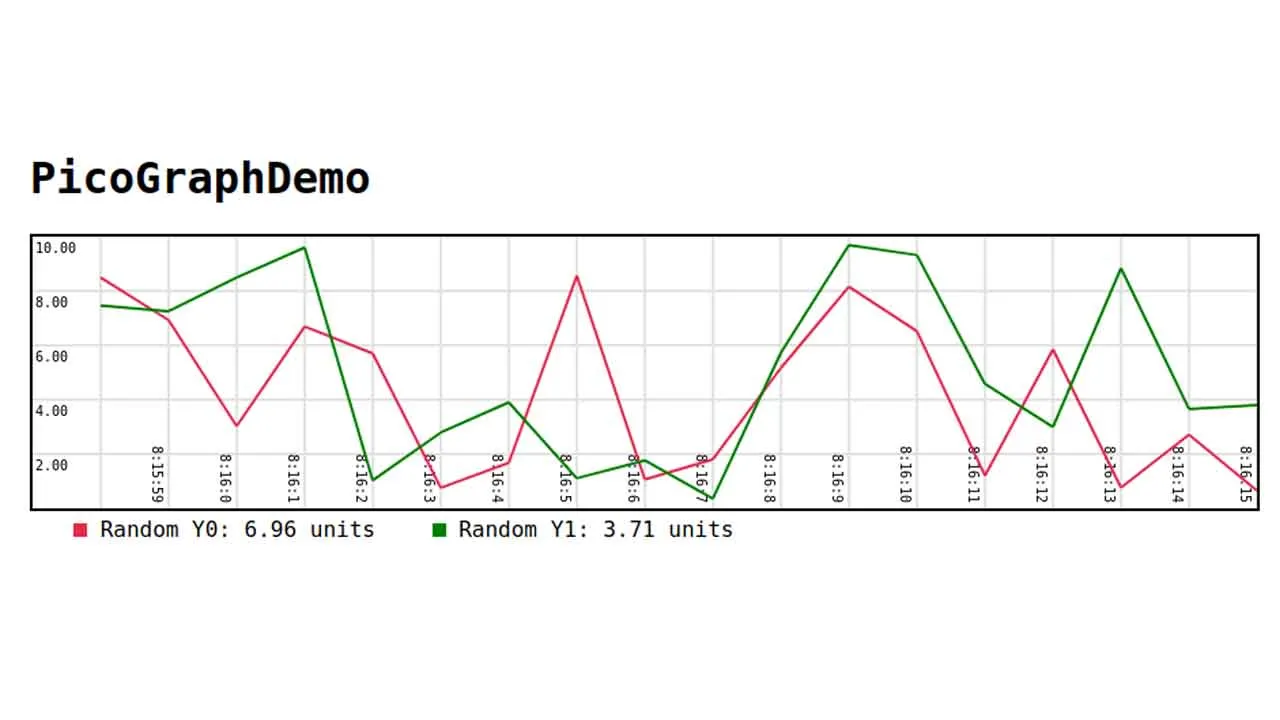
Simple and tiny graphing library for javascript.
Demo

<!DOCTYPE html>
<html>
    <head>
        <title>PicoGraphDemo</title>
        <script src="picograph.js"></script>
    </head>
    <body style="font-family: Lucida Console, Monaco, monospace;">

        <h1>PicoGraphDemo</h1>

        <!-- Canvas for the graph -->
        <canvas id="graphDemo"
            style="width: 900px; height:200px; border:2px solid #000000;">
        </canvas>

        <!-- div for legends/labels -->
        <div id="graphLabels"></div>

        <script>
            /* Create graph using picograph */
            var demograph = createGraph("graphDemo",
                ["Random Y0", "Random Y1"],
                "units", "graphLabels", 50, 10, 0, true, true);

            /* Update values every second */
            setInterval(updateEverySecond, 1000);

            function updateEverySecond() {
                /* Get new values */
                yrand0 = Math.random()*10;
                yrand1 = Math.random()*10;

                /* Update graph */
                demograph.update([yrand0, yrand1])
            }

        </script>
    </body>
</html>
Documentation
function createGraph(canvasID, labels, unit, labelDivID, intervalSize,
    maxVal, vlines=false, timestamps=false, scalesteps=5, vlinesFreq = 1)
Arguments :
- canvasID : The id of
<canvas>tag for the graph. - labels : List/array of string for label names.
- unit : The unit for the values.
- labelDivID: ID of the
<div>tag to place graph labels/legend. - intervalSize: Amount of pixels to shift the graph on update.
- maxVal: Approximate maximum value. Picograph can autoscale, this argument is only for initial value.
- minVal: Approximate minimum value. Picograph can autoscale, this argument is only for initial value.
- vlines: Show vertical lines.
- timestamps: Show timestamps.
- scalesteps: Number of scale lines to draw on the graph.
- vlinesFreq: Vertical lines and timestamps will be drawn every
vlinesFreq*intervalSize. Increase this if the vertical lines are too crowded.
Returns : Graph object.
Graph.update(values)
Arguments :
- values : Array of values to add to the graph.
Note
Always use CSS or style to set height and width of the canvas. Do not use height and width attributes of the canvas tag, it may cause scaling issues.
Correct Way:
<canvas id="graphDemo" style="width: 900px; height:200px">
Or you can use CSS flex box, the canvas should be surrounded by
<div style="flex-basis: 0; flex-grow: 1;">
Incorrect Way:
<canvas id="graphDemo" width=900 height=200">
Download Details:
Author: RainingComputers
Source Code: https://github.com/RainingComputers/picograph.js
#javascript
8.20 GEEK