If you haven’t seen it yet, check out the Netflix series, _Connected. _It’s a good show. The host, Latif Nasser, discusses various subjects in popular science. Netflix touts it as a series “that investigates the surprising and intricate ways in which we are connected to each other, the world and the universe.” [1]
In Numbers, the fourth episode, Latif explores Benford’s Law (BL), also known as the First Digit Law. It’s an observation that many datasets, both man-made and from nature, contain more digits that start with the number 1 than any other digit, about 30% of all numbers. And the subsequent leading digits drop down in frequency until number 9, which appears as the first digit in only about 5% of the numbers in the datasets. This is surprising because you would expect the distribution of the nine possible leading digits of numbers to be evenly spread out at around 11% each.
The show looks at the history of BL and shows that such varied datasets like the sizes of volcanoes, combined lengths of notes in classical music, and financial statements from companies seem to follow BL.
There is one question that was asked, but never really answered — why do many datasets follow BL? The show implies that the existence of BL reveals some sort of deep cosmic scheme of the universe.
Here’s a simple explanation that was never mentioned by Nasser, nor anyone he interviewed:
Datasets comprised of numbers that are products of multiple, independent factors will tend to follow Benford’s law.
This explanation has been known for a while [2][3][4] but didn’t quite make it into the show. Benford’s Law is not a mysterious property of our universe. It’s just basic math.
Overview
In this article, I’ll cover a brief background of BL, explain two key concepts: normal distributions and logarithms, show how a dice rolling exercise can lead to BL, and finally take a look at some real datasets to see if this explanation holds up.
Background
Benford’s law is named after the American physicist Frank Benford who published a paper in 1938 called “The Law of Anomalous Numbers” which describes the frequencies of first digits of numbers observed in datasets [5]. Note that this phenomenon had previously been observed and published by Canadian astronomer Simon Newcomb in 1881 [6].
(Brief side note: The fact that things are often named for someone who didn’t discover it first is common. In fact, there is a name for this, Stigler’s Law of Eponymy. It was proposed by the American statistics professor Stephen Stigler in 1980 when he wrote that no scientific discovery is named after its original discoverer [7]. In an ironic twist, Stigler acknowledged that the American sociologist Robert Merton had previously discovered “Stigler’s law”.)
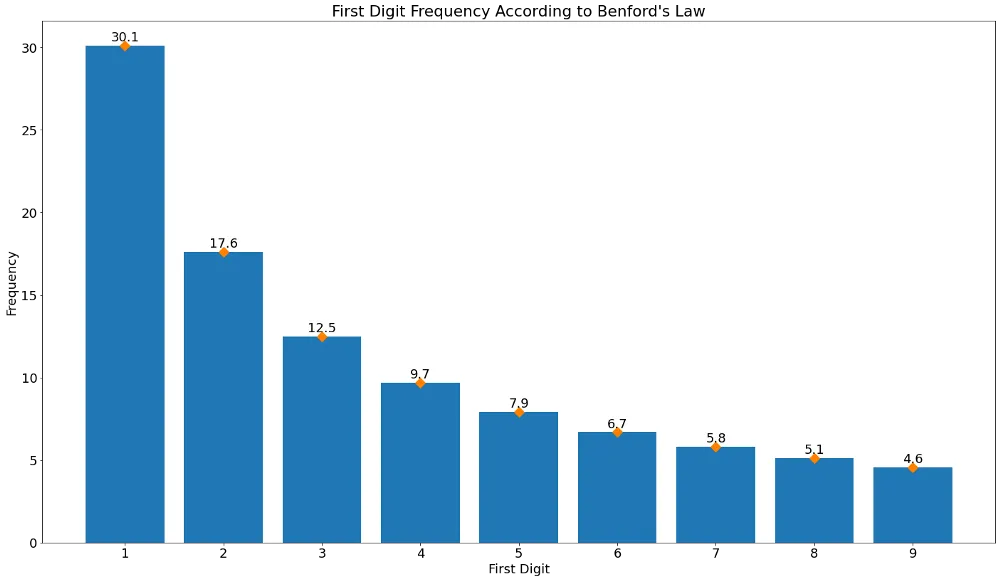
Back to Benford. He observed in his paper that many diverse datasets closely adhered to the following distribution of first digits, shown as percentages in the chart below.

#numerical-analysis #editors-pick #benfords-law #histograms #data-analysis