During the last couple of weeks, I’ve been simulating some data for a statistical inference project. While the topic of simulating data is quite broad and depends on the application, I thought that a more general approach of simulating data points that follow a particular probability distribution may be useful to those working on scientific experiments and mathematical modeling.
This post combines a few basic techniques in order to generate some simulated data that follow the distribution of a given probability density function (p.d.f).
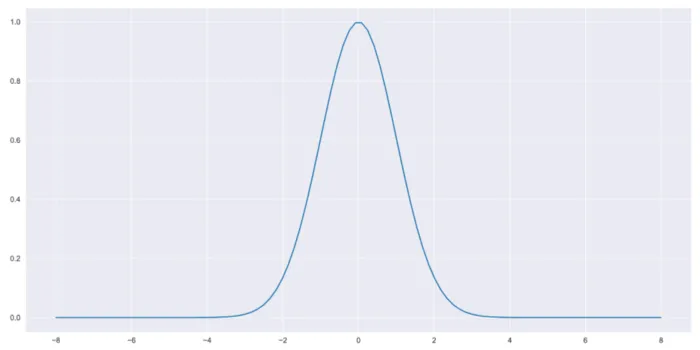
Let’s assume that we have a p.d.f of the form,
def pdf(x):
	    F = np.exp(-x**2/2)
	    return F
Plotting this to verify,
x = np.linspace(-8,8,100)
	plt.plot(x,pdf(x))
#python #mathematics #data-science #statistics #astronomy
1.20 GEEK