Java Virtual Machine (JVM) generates 3 critical artifacts that are useful for optimizing the performance and troubleshooting production problems. Those artifacts are:
- Garbage collection (GC) log
- Thread Dump
- Heap Dump
In this article, let’s try to understand these 3 critical artifacts, where to use them, how do they look, how to capture them, how to analyze them, and their differences.
1. Garbage Collection Log
a) What Is a GC Log?
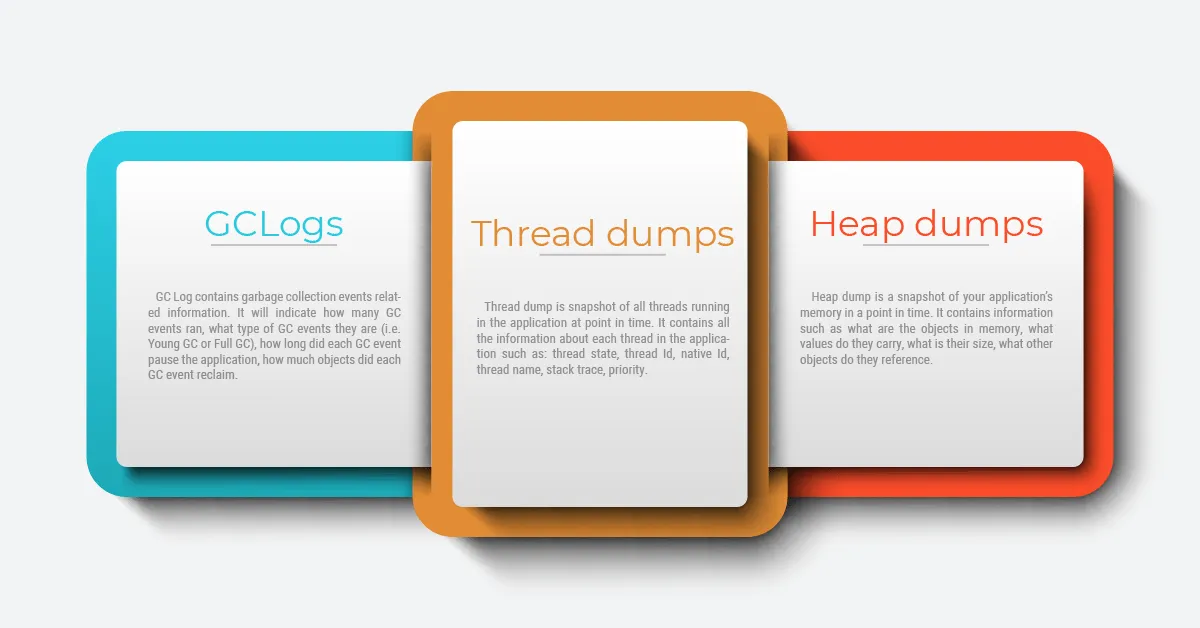
GC Log contains garbage collection events related information. It will indicate how many GC events ran, what type of GC events they are (i.e. Young GC or Full GC), how long each GC event pause the application, how much objects did each GC event reclaim.
b) What Does a GC Log Look Like?
Sample garbage collection log file can be found here.
c) Where Are GC Logs Used?
Garbage collection logs are used to study the application’s GC and memory performance. It’s used to optimize the GC pause times, it’s used to identify optimal memory size for your application, it’s also used to troubleshoot memory-related problems.
d) How to Generate a GC Log?
You can generate garbage collection logs by passing the following JVM arguments:
For Java versions until 8:
Java
xxxxxxxxxx
1
1
-XX:+PrintGCDetails
2
-XX:+PrintGCDateStamps
3
-Xloggc:<file-path>
#threading #heap dump #java threads #thread dump #garbage collection in java #heap dump analysis #java gc #garbage collectors #jvm arguments #gc log