Agreat YouTube maths channel is 3Brown1Blue. A distinctive feature of the videos is the visuals, which you can replicate — as long as you’ve got some spare time to get the Python library Manim (written by the channel’s author Grant Sanderson) to work.
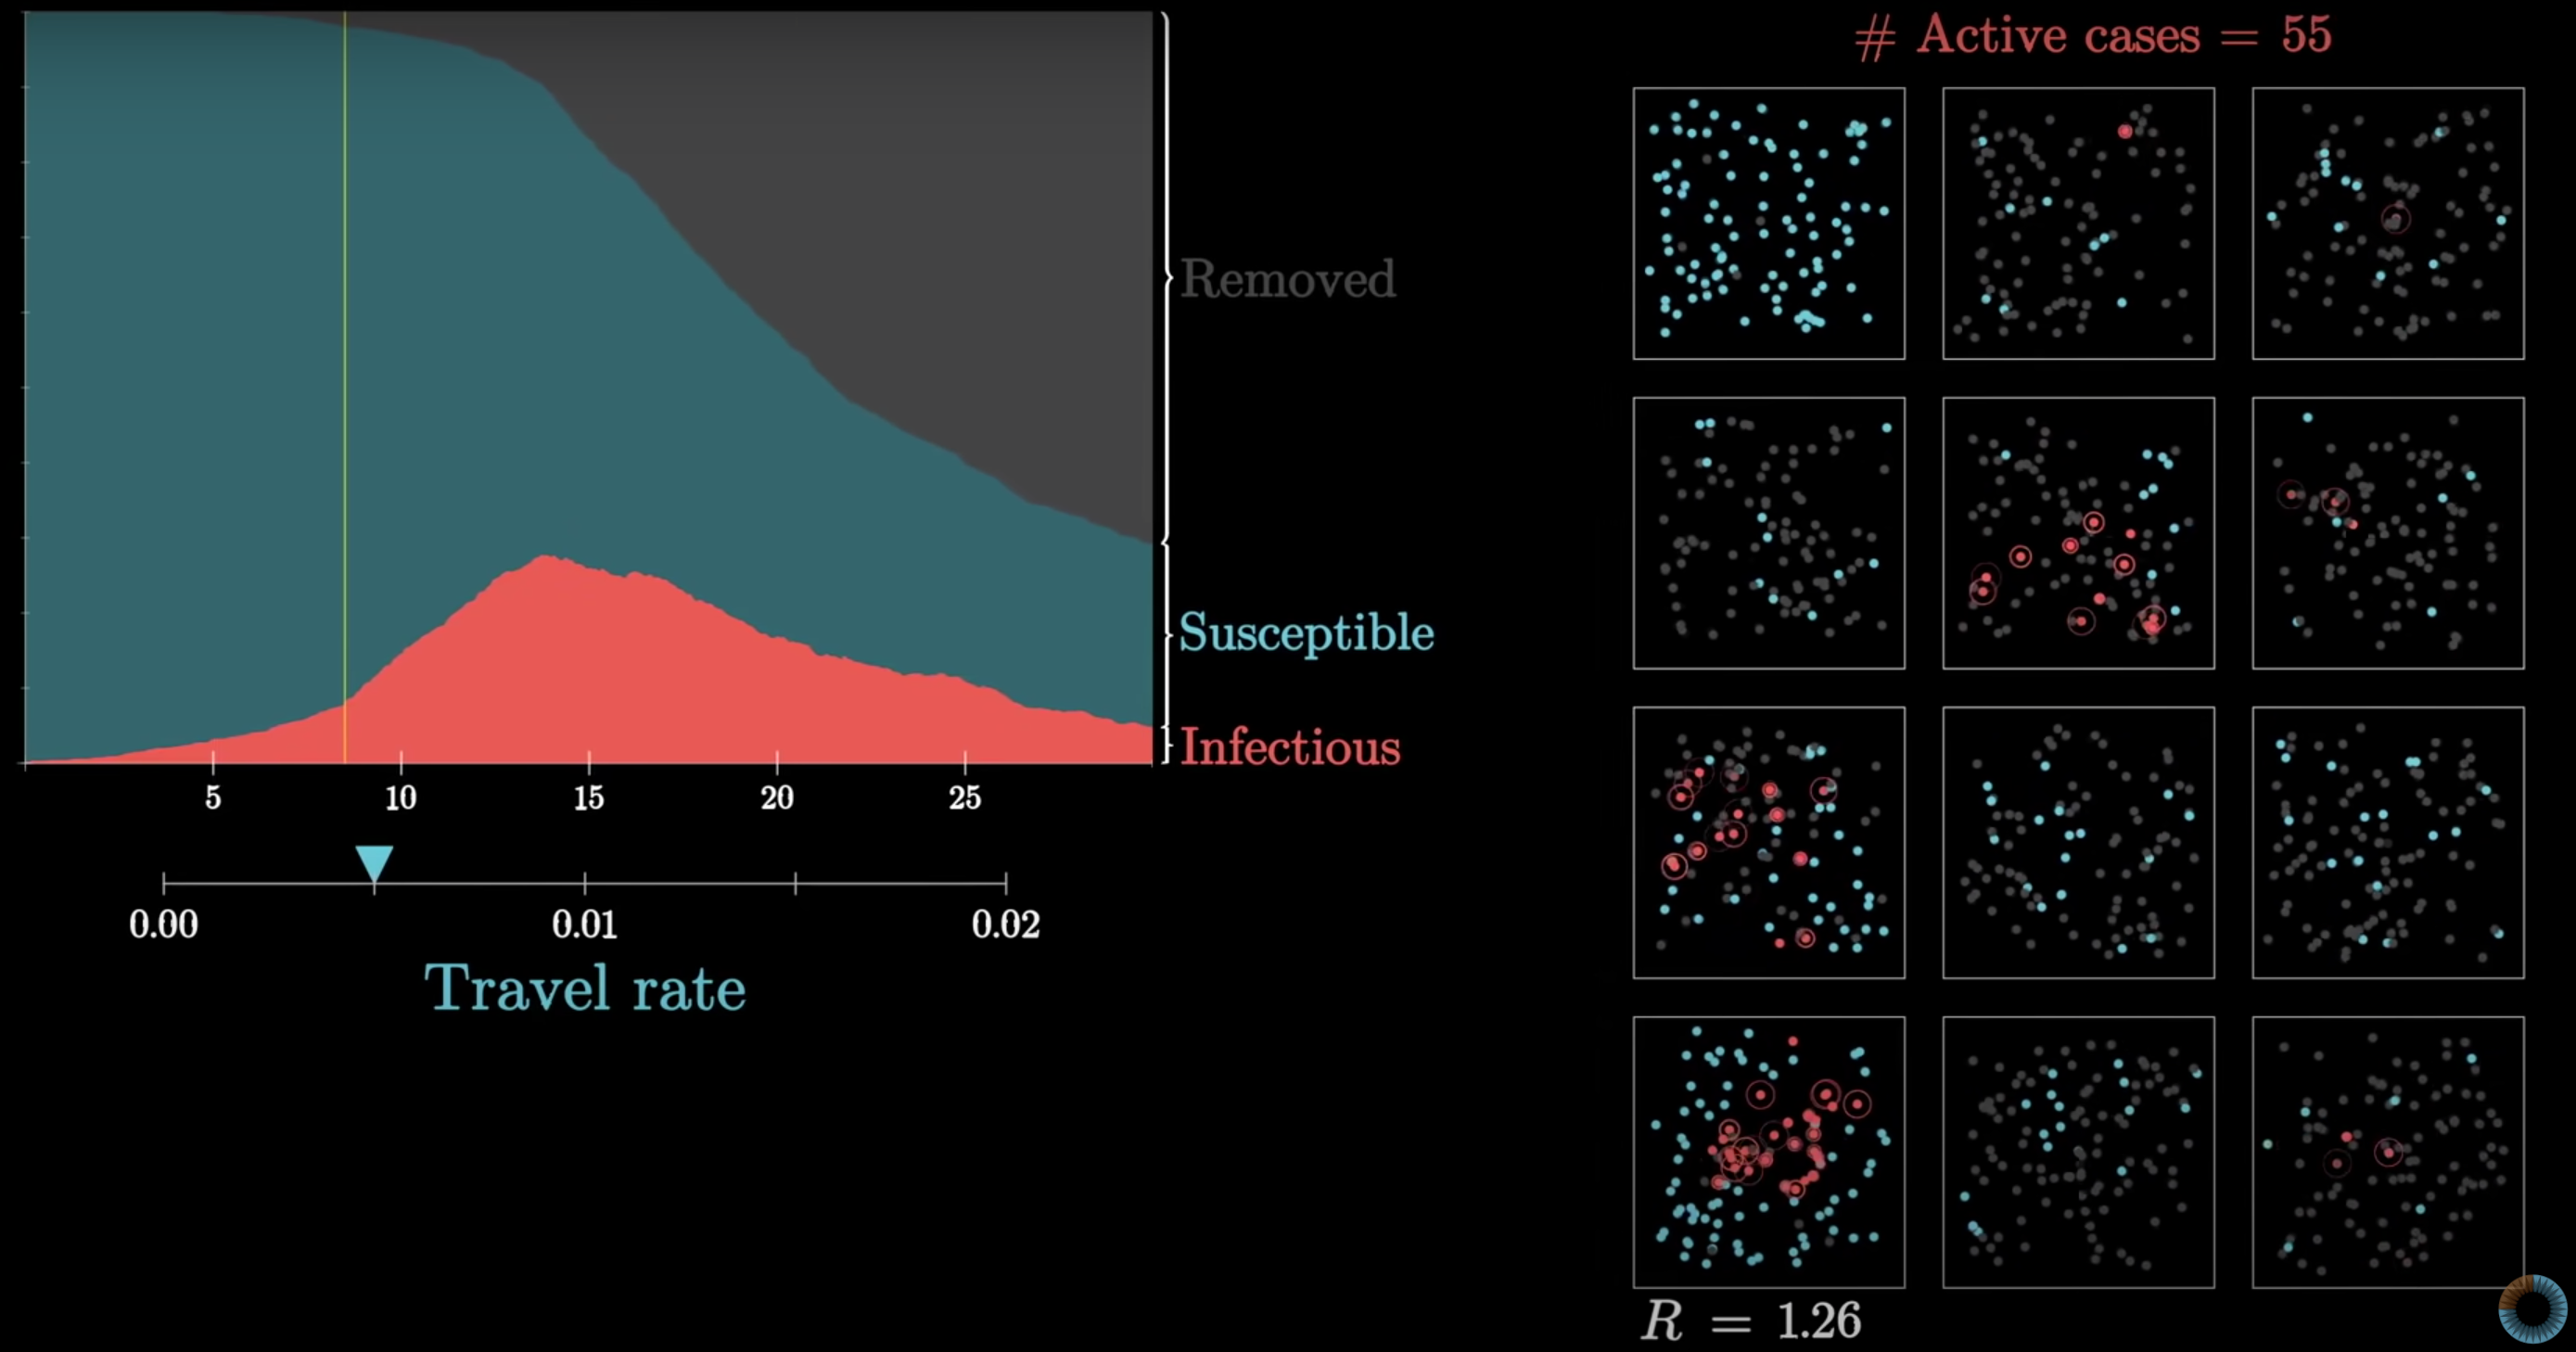
Yes, you could simulate a pandemic with Manim (screenshot from 3Brown1Blue YoutTube video).
To get Manim to work is not something I say lightly and you may experience a mild anger reaction after an update Manim breaks something that was working well before. Having said that, we can only be grateful for this extraordinary open-source tool (which you could contribute to its development).
My recommendation is patience and to stick to these tips:
- Start with a new virtual environment. I’ve managed to set-up Manim in Windows and macOS using conda.
- Check any of these resources for installing the system-wide and Python dependencies it needs (and gain inspiration on how to get most of Manim): Repperium Science, Talking Physics, or Manim GitHub itself.
- LaTeX is only needed if you intend to show visuals with text or equations, and MikTex has been my choice for both Windows and macOS installs.
- Clone or ZIP download the Manim GitHub repository (and if you need an older version, check how to download a specific commit from GitHub repository here).
- If using version control tools, be extra careful if you plan to keep your local version of Manim up-to-date with the Manim GitHub repository.
Sooner or later you’ll get it working, don’t give up!
To test that Manim is working correctly, if using Conda (highly recommended) then open Anaconda prompt in Windows or terminal in macOS, activate the environment where you’ve installed the dependencies, navigate to where you’ve cloned or unzipped Manim’s repository and run one of the pre-defined examples (e.g. SquareToCircle will produce a short clip of a square that transforms to a circle). If successful, you’ll have created your first Manim animation!
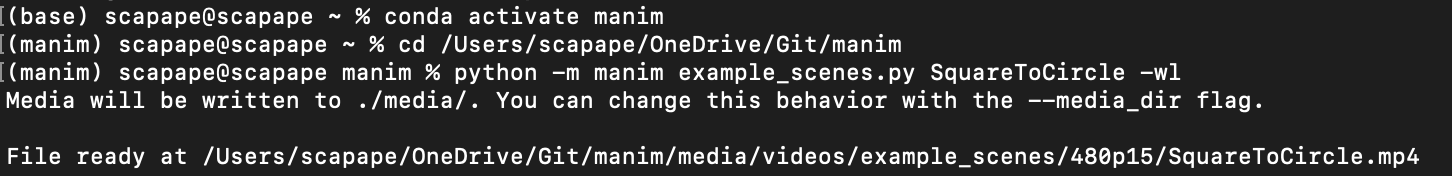
Activating my ‘manim’ conda environment and navigating to my ‘manim’ local folder in terminal MacOS.
Now it’s time to have some _maths _fun. For your projects, I’d recommend creating a folder (I called mine ‘myAnimations’) inside Manim’s folder structure. The following script will animate two simple functions in a graph.
from manimlib.imports import *
	import math

	''' I named the animation 'Example'. It
	inherits all the magic from GraphScene '''
	class Example(GraphScene):
	    CONFIG = {
	        "graph_origin": 3*DOWN + 5*LEFT,
	        "x_min": 0,
	        "x_max": 2,
	        "x_tick_frequency": 0.5,
	        "x_labeled_nums": [0, 1, 2],
	        "y_min": 0,
	        "y_max": 4,
	        "y_tick_frequency": 0.5,
	        "y_labeled_nums": [0, 1, 2, 3, 4],
	        "y_axis_height": 5,
	        "exclude_zero_label": False,
	    }

	    def construct(self):
	        # Make axes
	        self.setup_axes(animate=True)

	        # Make graph
	        graphX = self.get_graph(self.functionX)
	        labelX = self.get_graph_label(graphX, label="y = x")
	        graphXCopy = self.get_graph(self.functionX)

	        graphX2 = self.get_graph(self.functionX2)
	        labelX2 = self.get_graph_label(graphX2, label="y = x^{2}")

	        # Make and move text
	        text = TextMobject("and job done.")
	        text.shift(1*UP, 1*LEFT)

	        # Make animation
	        self.play(ShowCreation(graphX))
	        self.play(Transform(graphX, graphX2))
	        self.play(FadeOut(graphX))
	        self.play(Write(graphXCopy), Write(graphX2),
	                  Write(labelX), Write(labelX2))
	        self.play(Write(text))
	        self.wait(2)

	    # Define functions
	    def functionX(self, x):
	        return (x)

	    def functionX2(self, x):
	        return(x**2)
#youtube #python #mathematics #videos