Using time series data and asking RNN ‘When does the next fault occur ?’

Predictive maintenance is very important for manufacturers as well as the maintainers, which lowers maintenance cost, extend equipment life, reduce downtime and improve production quality by addressing problems before they cause equipment failures.
“Predictive maintenance techniques are designed to help determine the condition of in-service equipment in order to estimate when maintenance should be performed” — source Wikipedia
_In this post, I would like to demonstrate that the use of __RNN(Recurrent Neural Network)/LSTM(Long Short Term Memory) __architecture is not only __more accurate but it performs better in classifying the results accurately __when compared to the previous __CNN (Convolution Neural Network) _approach, written by Marco Cerliani (read here).
Dataset
This post uses the C-MAPSS datasetfor the predictive maintenance of the Turbofan Engine. Here the challenge is to determine the **Remaining Useful Life (RUL) **until next fault that occur in the engine.
The dataset can be found (here), here’s a brief on the dataset,
“The engine is operating normally at the start of each time series, and develops a fault at some point during the series.
In the training set, the fault grows in magnitude until system failure.
In the test set, the time series ends some time prior to system failure.
The following are the conditions of the engine that are used in the training of the model
Train trjectories: 100
Test trajectories: 100
Conditions: ONE (Sea Level)
Fault Modes: ONE (HPC Degradation)
Understanding the Dataset
Once we load the dataset, we obtain the time series data of 100 engines that contains the operational settings and sensor readings of each 100 engines with different senarios where the fault occurs and a total of 20631 training examples. To illustrate, below are the first 5 training examples of our training dataset.
train_df.head()
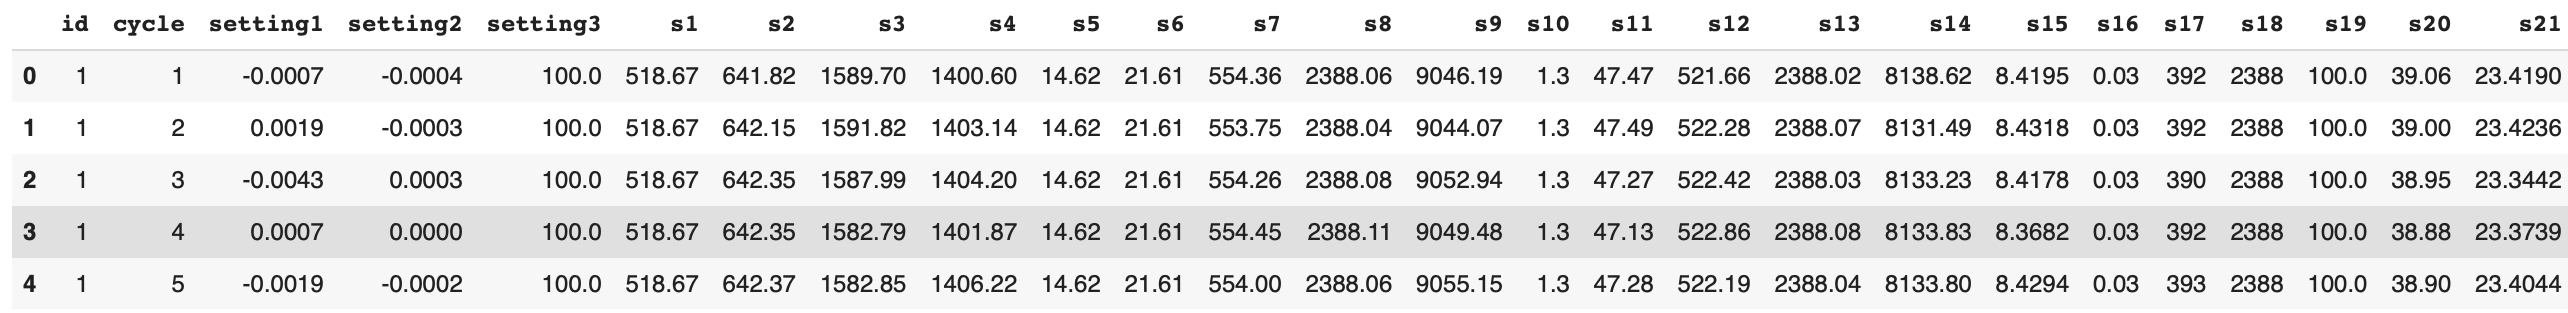
Fig 1 : Training Data
To further understand the data given, (see Fig 2) describes that for a given engine how many cycles are left before the next fault occurs.
Example 1 : Engine id number 69 (farthest left) approximately has 360 cycles remaining before fault.
Example 2 : Engine id number 39 (farthest right) approximately has 110 cycles remaining before fault.
train_df.id.value_counts().plot.bar()
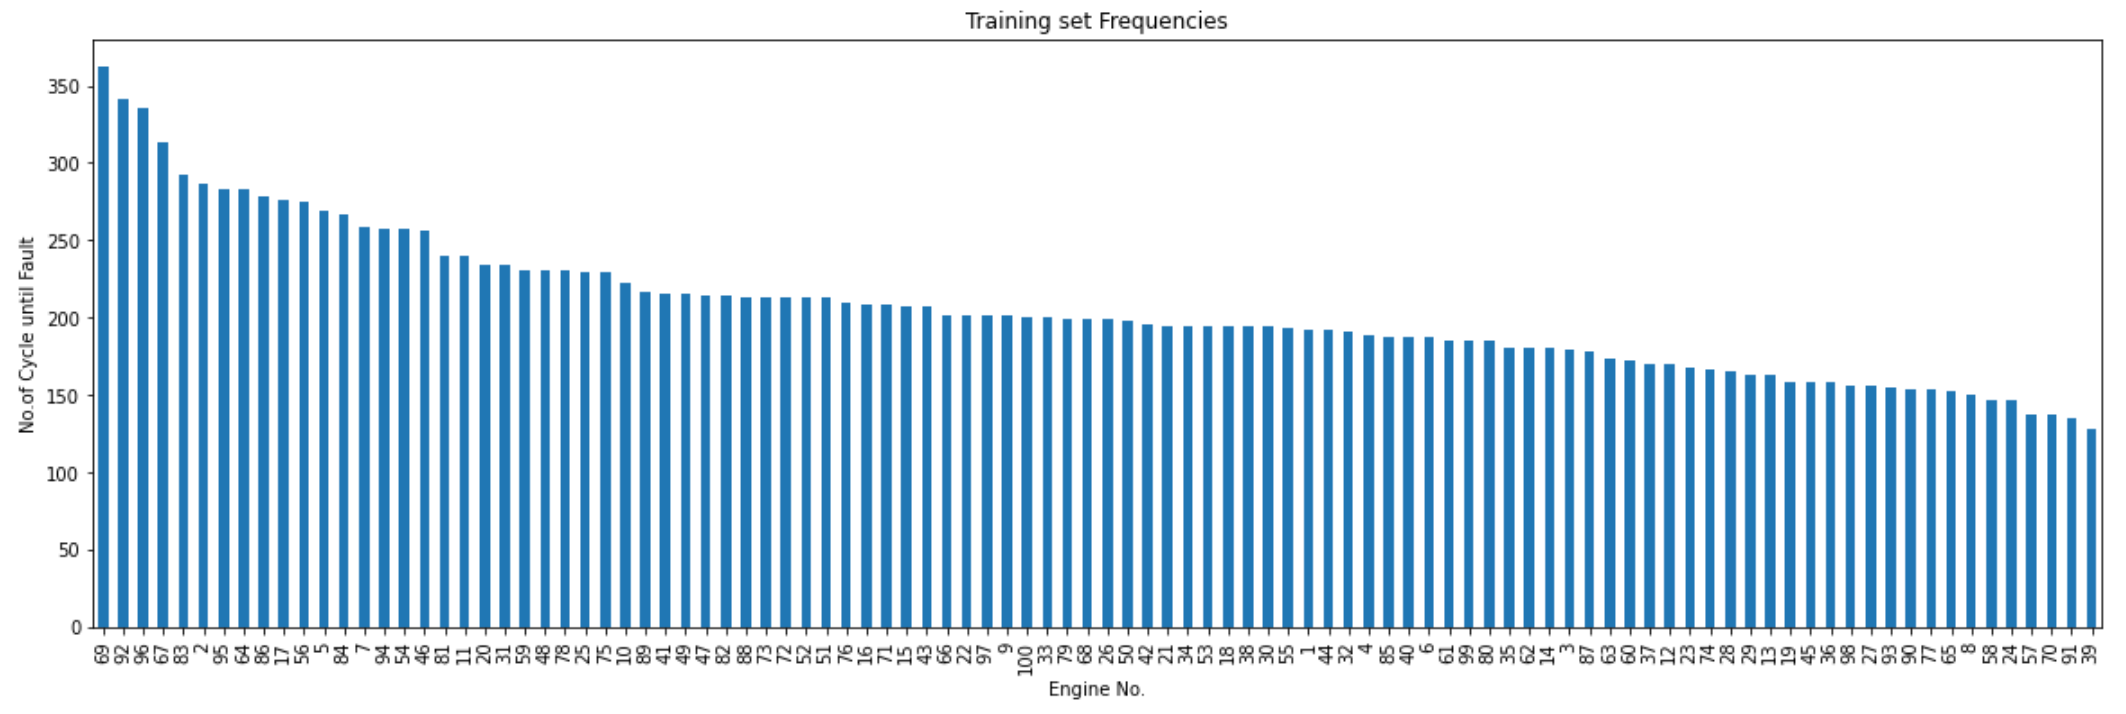
Fig 2: Engine with their respective Remaining Useful Cycles until fault
The following (Fig3 and Fig 4) are time series data for engine whose id is 69,
engine_id = train_df[train_df['id'] == 69]

ax1 = engine_id[train_df.columns[2:]].plot(subplots=True, sharex=True, figsize=(20,30))

Fig 3: Time series readings of Operational setting 1,2 and 3 and sensors reading of s2 up until s7

Fig 4: Time series readings for the sensors s8 up until s20
*The images (fig2, fig 3 and fig4) are obtained by using the source code from GitHub Notebook (here), by Marco Cerliani.
#predictive-analytics #deep-learning #deep learning
