Not long ago I published a similar article on how to use LSTMs to make Stock predictions using a Vanilla Neural Network. Because I wanted to minimize the complexity of the problem, I used a monovarietal model. Today I will make the use of a multivariate model to train my AI. It will be more complex, but it will begin to be more realistic. The structure I will be using will be almost identical to the one followed in the previous article, with the only difference that this one will be able to incorporate multiple variables (GOOG price and GDP).***DISCLAIMER: as exciting as it may look, this is a low-resolution simulation of a financial analysis model. Real-world models are much more complex, require Multi-variable data and are not limited to a single AI, but rather a collection of AI working together. Therefore, use this model for training on building Neural Networks Only: DO NOT ATTEMPT TO USE IT ON REAL TRADING, it will lack reliability due to its lack of complexity.
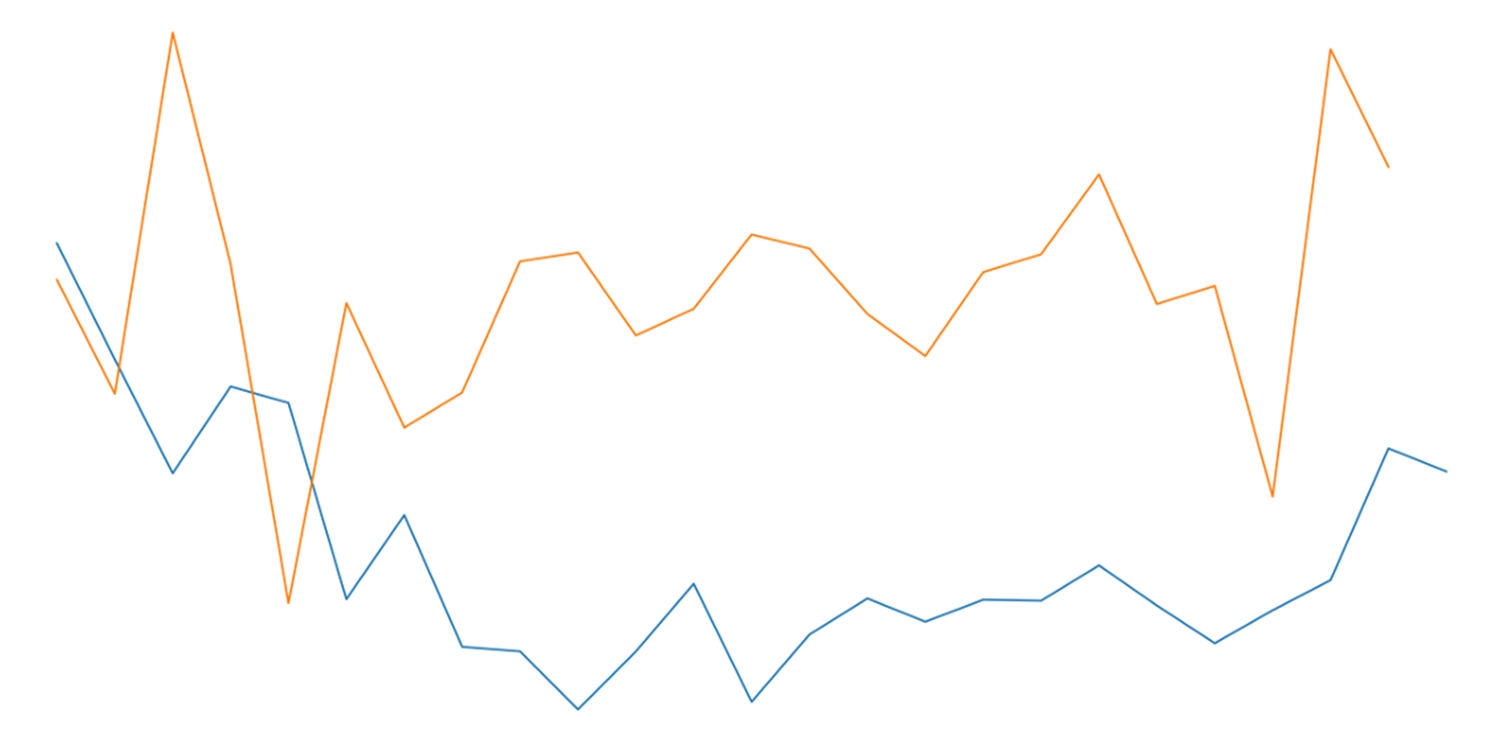
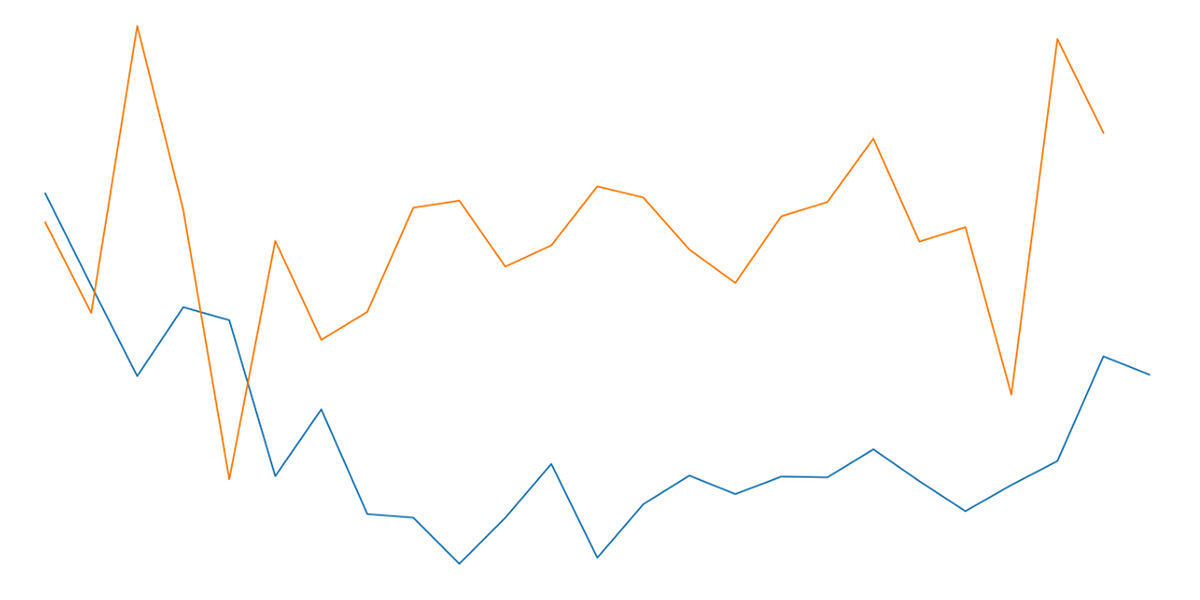
Final Result
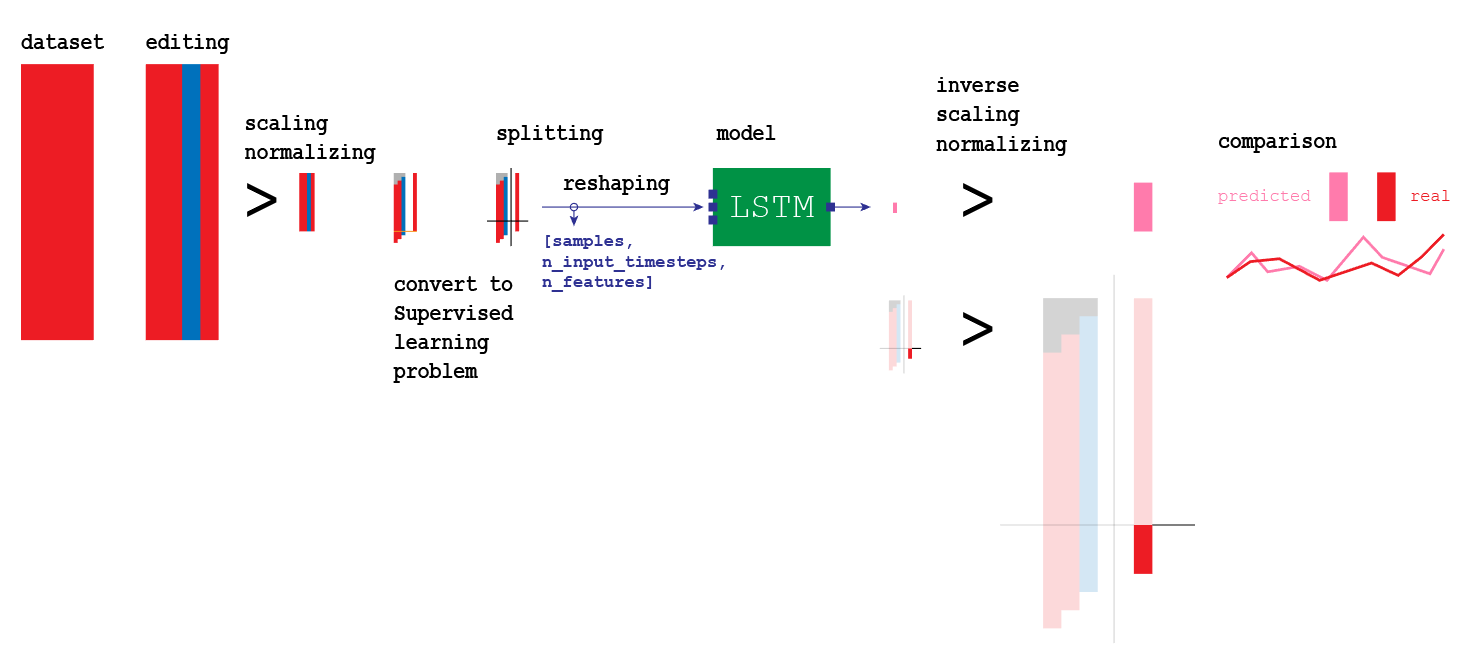
Entire Procedure
As usual, I will instruct you on how to proceed using my personal graphical notes as a guide. The scheme above fairly summarized the full procedure in creating a stacked multivariate LSTM neural network for time-series predictions.
Setting up the LSTM
Steps in the process:
- Importing ModulesGenerating GDP per day time seriesImporting DataFrameDataFrame preprocessingDataFrame conversion to supervised problemDataFrame splitting into X_train, y_train, X_test, y_testReshaping input into [samples, n_input_timesteps, n_features]Create the LSTM modelFit the model using X_train, y_trainMaking an estimate for every single forward stepInvert preprocessing for the outputComparing predictions with estimations
Importing GOOG Stock
# load dataset
import pandas as pd
X = pd.read_csv('/content/drive/My Drive/Colab Notebooks/Projects/20200525_GOOG_Multivariate_LSTM/GOOG.csv')
#original copy without preprocessing
X = X.drop(['High', 'Low', 'Close', 'Adj Close', 'Volume'], axis=1)
index = X.pop('Date')
X
For your convenience, I have already saved the stock performance of 1 year of Google stock (GOOG) in a .csv file that you can download here. Because I use Google Colab, I will load it from my personal drive. You can download the .csv and import it from your own path.
Generating GDP per day
GDP is released 4 times every year, once per quarter. Because I do not want to jump from one value to the other instantaneously, I want to calculate the GDP variation for every day of the year, so that I can adapt it to the Google Stock data. The two time-series need to be standardized, in this case, they need to show data for every day of the year without interruptions.
#GDP interpolation
import matplotlib.pyplot as plt
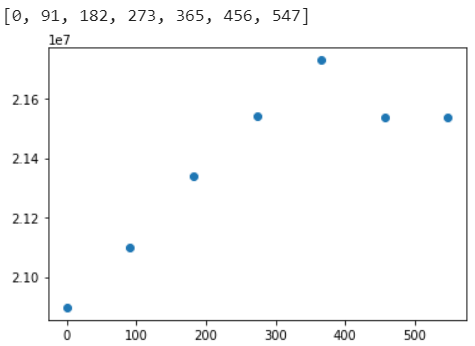
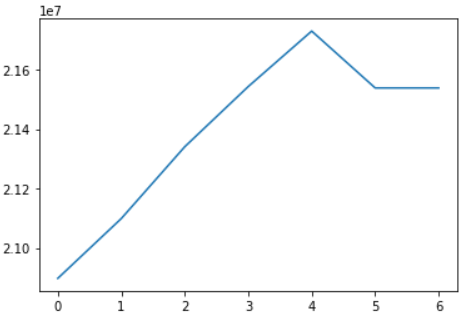
y = [20897804, 21098827, 21340267, 21542540, 21729124, 21537940, 21537940]
x = [int((365/4)*0), int((365/4)*1), int((365/4)*2), int((365/4)*3), int((365/4)*4), int((365/4)*5), int((365/4)*6)]
plt.plot(x, y, ‘o’)
x
Because I only had the value of the GDP, but I could not use the date because incompatible with the Google Stock, I opted for using the number of days starting from 0. Essentially, on day 0, the GDP si 20,897,804, at day 91 the GDP is 21,098,827…
Interpolation
I have created a table with all the GDP values obtained from a government website. I will use those 7 quarters to create a time-series.
from scipy.interpolate import interp1d
import numpy as np

f = interp1d(x, y, kind='cubic')
plt.plot(f(x))

Adapting GDP function to days of the year
As you have noticed, the x-axis did not show the correct days, but a count for every new GDP input. I have to adapt it to the starting day of the Google Stock dataset so that I can synchronize both datasets.
list_day = list()
list_GDP = list()
for _ in range(len(index)):
  year = int(index[_][0]+index[_][1]+index[_][2]+index[_][3])
  month = int(index[_][5]+index[_][6])
  day = int(index[_][8]+index[_][9])
  date = datetime.datetime(year, month, day)
  date_add = int(date.strftime('%j'))
  history_day = date_add+((year-2019)*365)
  list_day.append(history_day)
  list_GDP.append(f(history_day))
plt.plot(list_day, list_GDP, 'o', linewidth=1, markersize=2)
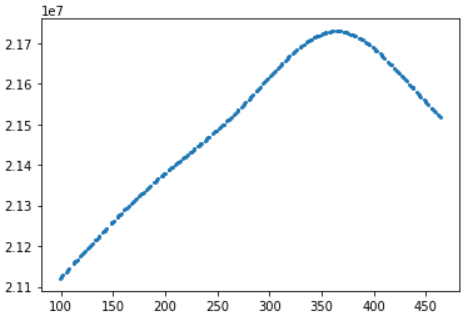
Full interpolation of GDP: resulting in GDP per day
Merging the datasets
list_GDP = pd.DataFrame(list_GDP)
list_GDP.columns = ['GDP']
list_GDP
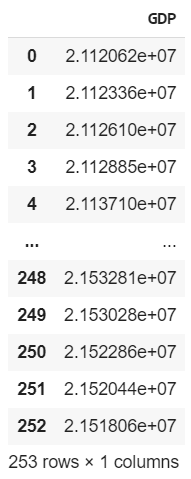
An overview of the DataFrame I have just been creating
#merge Google Stock with GDP
X = pd.concat([X, list_GDP], axis=1)
X
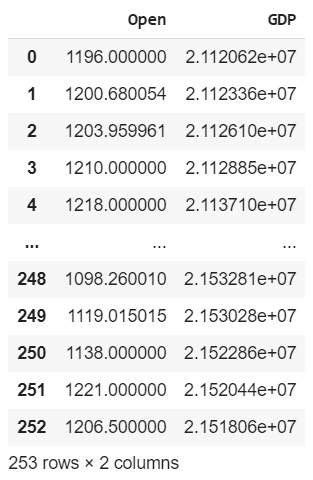
Both GOOG Stock price and GDP
I can finally place the datasets one in front of the other, now that they have corresponding dates. I will use the GDP values as a predictor for the Google Stock data. Compared with the previous article, the time-series will not attempt to predict itself based only on its previous data, but it will also use the GDP values.
#google #deep-learning #deep learning