In this article, we’ll review five JavaScript libraries that allow you to create online organizational charts. To make this info useful for different categories of readers, we’ve gathered together libraries with different functionality and pricing policy. To help you decide whether one of them is worthy of your attention or not, we’ll take a look at the main features and check if the documentation is user-friendly.
DHTMLX Diagram Library
The DHTMLX diagram library allows creating easily configurable graphs for visualization of hierarchical data. Besides org charts, you can create almost any type of hierarchical diagrams. You can choose from organizational charts, flowcharts, block and network diagrams, decision trees, mind maps, UML Class diagrams, mixed diagrams, and any other types of diagrams. This variety of diagrams can be generated using a built-in set of shapes or with the help of custom shapes.
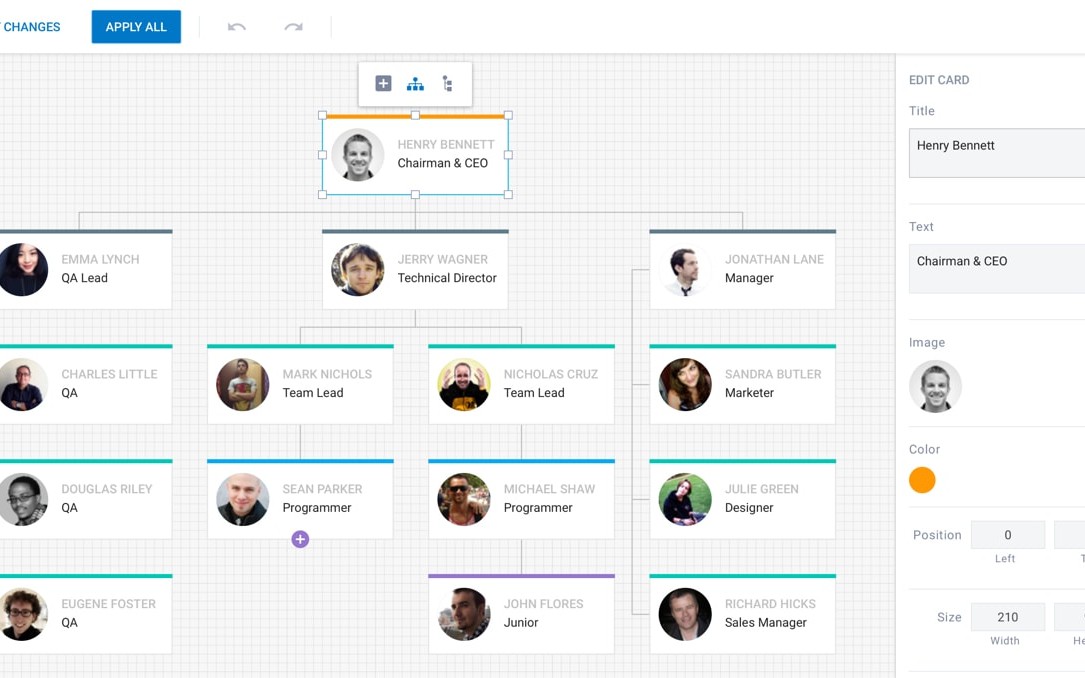
You can set up any diagram shape you need with text, icons, images, and any other custom content via templates in a few lines of code. All these parameters can be later changed from the UI via the sidebar options in the editor.
The edit mode gives an opportunity to make changes on-the-fly without messing with the source code. An interactive interface of the editor supports drag-and-drop and permits you to change each item of your diagram. You can drag diagram items with your mouse and set the size and position property of an item via the editor. The multiselection feature can help to speed up your work in the editor, as it enables you to manipulate several shapes.
The library has an exporting feature. You can export your diagram to a PDF, PNG, or JSON format. Zooming and scrolling options will be useful in case you work with diagrams containing a big number of items. There is also a search feature that helps you to quickly find the necessary shape and make your work with complex diagrams even more convenient by expanding and collapsing shapes when necessary. To show the structure of an organization compactly, you can use the vertical mode.
The documentation page will appeal both to beginners and experienced developers. A well-written beginner’s guide contains the source code with explanations. A bunch of guides will help with further configuration, so you’ll be able to create a diagram that better suits your needs. At the moment, there are three types of licenses available. The commercial license for the team of five or fewer developers costs $599, the enterprise license goes for $1299 per company, and the ultimate license has a price tag of $2899.
#javascript #web dev #data visualization #libraries #web app development #front end development #javascript libraries #org chart creator