You can also find this on GitHub. This GitHub repository includes everything you need to run the analyses yourself.
Introduction
For many data scientists, the basic workhorse model is multiple linear regression. It serves as the first port of call in many analyses, and as the benchmark for more complicated models. One of its strengths is the easy interpretability of the resulting coefficients, something that especially neural networks struggle with. However, linear regression is not without its challenges. In this article, we focus on one particular challenge: dealing with large sets of features. Specific issues with large datasets are how to select the relevant features for our model, how to combat overfitting and how to deal with correlated features.
Regularisation is a very potent technique that helps with the above-mentioned issues. Regularisation does this by expanding the normal least squares goal or loss function with a term which limits the size of coefficients. The main goal of this article is to get you familiar with regularisation and the advantages it offers.
In this article you will learn about the following topics:
- What regularisation is in more detail and why it is worthwhile to use
- What different types of regularisation there are, and what the terms L1- and L2-norm mean in this context
- How to practically use regularisation
- How to generate features for our regularised regression using tsfresh
- How to interpret and visualise the coefficients of the regularised regression
- How to optimize the regularisation strength using crossvalidation
- How to visualise the outcomes of the crossvalidation
We will start this article off with a more theoretical introduction to regularisation, and finish up with a practical example.
Why use regularisation and what are norms?
The following figure shows a green and a blue function fitted to the red observations (attribution). Both functions perfectly fit the red observations, and we really have no good way of choosing either of the functions using a loss function.
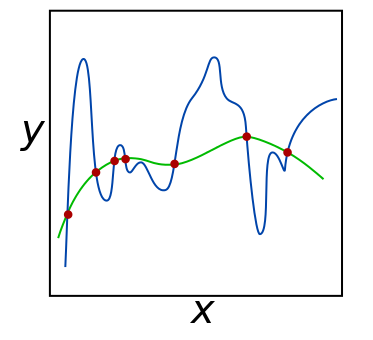
Not being able to choose either of these functions means that our problem is underdetermined. In regression, two factors increase the degree of underdetermination: multicollinearity (correlated features) and the number of features. In a situation with a small amount of handcrafted features this can often be controlled for manually. However, in more data driven approaches we often work with a lot of (correlated) features of which we do not a priori know which ones will work well. To combat undetermination we need to add information to our problem. The mathematical term for adding information to our problem is regularisation.
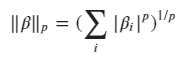
A very common way in regression to perform regularisation is by expanding the loss function with additional terms. Tibshirani (1997) proposed to add the total size of the coefficients to the loss function in a method called Lasso..) A mathematical way to express the total size of the coefficients is using a so called norm:
#regularization #logistic-regression #sklearn #tsfresh #python