In this article, I will go over multiple classification algorithms in an attempt to find suitable models for market forecasting. More specifically, SPDR S&P 500 Trust ETF (SPY) is picked as a convenient way to analyze the S&P 500.
A big focus on this project will also be feature selection. I want to use this project to gain some hands-on experience in implementing different feature selection methods and learn how to apply them optimally.
Table of Contents
- Classification Models
- Data
- Univariate Feature Selection
- Correlation-Based Feature Selection
- Recursive Feature Elimination with Cross-Validation
- Comments about Cross-Validation in Financial Time Series
- Principal Component Analysis
- Hyper-Parameter Optimization
- Model Performance Evaluation
- Trading Strategy Analytics
- Conclusion
1. Classification Models
The goal of this research will be building classification models to predict the sign of forward returns (next-day open-to-close percentage return) of SPY. If the forward return is higher than 0%, then our target variable _y _will be assigned value 1, else 0.
![](https://miro.medium.com/max/508/1*kwrV8lFH-bEqDWamQf0DEA.png
The dictionary below covers the different classification models that are included in this research. We will compare different families of classification models from traditional linear models to more sophisticated ensemble-based models.
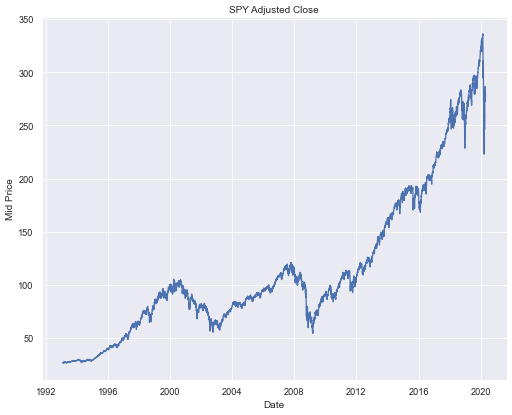
2. Data
This project consists of multiple groups of datasets, each represents a different aspect of the financial market, such as sector ETFs, foreign exchange rates, commodity futures, and economic data. Additional derived features are also computed for each time series, i.e. rolling mean, standard deviation, skewness, etc.
All models will be trained on data from February 2000 to April 2016, tested on data from April 2016 to April 2020.
We end up having 3984 rows of data for training and 996 rows for testing, with 1039 columns of features in each. We standardize all of our features by removing the mean and scaling to unit variance.
Since the article is aimed to focus more on feature selection & classification algorithms, I will skip the data preprocessing sections. More details regarding the data used in this research can be seen in my notebook linked at the end of the article. All datasets are retrieved from Quandl and Yahoo Finance.
#classification #algorithmic-trading #finance #features #machine-learning #algorithms