As with most interesting projects, this one started with a simple question asked half-seriously: how much tuition do I pay for five minutes of my college president’s time? After a chance pleasant discussion with the president of my school (CWRU), I wondered just how much my conversation had cost me.
My search led to this article, which along with my president’s salary, had this table showing the salaries of private college presidents in Ohio:
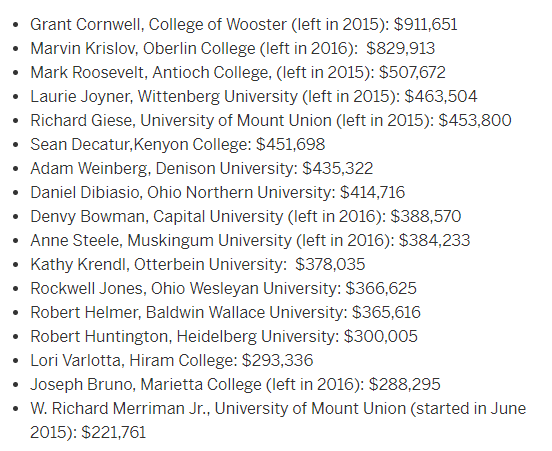
While I could have found the answer for my president, (SPOILER ALERT, it’s $48 / five minutes), and been satisfied, I wanted to take the idea further using this table. I had been looking for a chance to practice web scraping and regular expressions in Python and decided this was a great short project.
Although it almost certainly would have been faster to manually enter the data in Excel, then I would not have had the invaluable opportunity to practice a few skills! Data science is about solving problems using a diverse set of tools, and web scraping and regular expressions are two areas I need some work on (not to mention that making plots is always fun). The result was a very short — but complete — project showing how we can bring together these three techniques to solve a data science problem.
The complete code for this project is available as a Jupyter Notebook on Google Colaboratory (this is a new service I’m trying out where you can share and collaborate on Jupyter Notebooks in the cloud. It feels like the future!) To edit the notebook, open it up in Colaboratory, select file > save a copy in drive and then you can make any changes and run the Notebook.
Web Scraping
While most data used in classes and textbooks just appears ready-to-use in a clean format, in reality, the world does not play so nice. Getting data usually means getting our hands dirty, in this case pulling (also known as scraping) data from the web. Python has great tools for doing this, namely the requests library for retrieving content from a webpage, and bs4 (BeautifulSoup) for extracting the relevant information.
These two libraries are often used together in the following manner: first, we make a GET request to a website. Then, we create a Beautiful Soup object from the content that is returned and parse it using several methods.
# requests for fetching html of website
import requests
# Make the GET request to a url
r = requests.get('http://www.cleveland.com/metro/index.ssf/2017/12/case_western_reserve_university_president_barbara_snyders_base_salary_and_bonus_pay_tops_among_private_colleges_in_ohio.html')
# Extract the content
c = r.content
from bs4 import BeautifulSoup
# Create a soup object
soup = BeautifulSoup(c)
The resulting soup object is quite intimidating:

Our data is in there somewhere, but we need to extract it. To select our table from the soup, we need to find the right CSS selectors. One way to do this is by going to the webpage and inspecting the element. In this case, we can also just look at the soup and see that our table resides under a <div> HTML tag with the attribute class = "entry-content" . Using this info and the .find method of our soup object, we can pull out the main article content.
# Find the element on the webpage
main_content = soup.find('div', attrs = {'class': 'entry-content'})
This returns another soup object which is not quite specific enough. To select the table, we need to find the <ul> tag (see above image). We also want to deal with only the text in the table, so we use the .text attribute of the soup.
# Extract the relevant information as text
content = main_content.find('ul').text

We now have the exact text of the table as a string, but clearly is it not of much use to us yet! To extract specific parts of a text string, we need to move on to regular expressions. I don’t have space in this article (nor do I have the experience!) to completely explain regular expressions, so here I only give a brief overview and show the results. I’m still learning myself, and I have found the only way to get better is practice. Feel free to go over this notebook for some practice, and check out the Python re documentation to get started (documentation is usually dry but *extremely *helpful).
Regular Expressions
The basic idea of regular expressions is we define a pattern (the “regular expression” or “regex”) that we want to match in a text string and then search in the string to return matches. Some of these patterns look pretty strange because they contain both the content we want to match and special characters that change how the pattern is interpreted. Regular expressions come up all the time when parsing string information and are a vital tool to learn at least at a basic level!
There are 3 pieces of info we need to extract from the text table:
- The names of the presidents
- The names of the colleges
- The salaries
First up is the name. In this regular expression, I make use of the fact that each name is at the start of a line and ends with a comma. The code below creates a regular expression pattern, and then searches through the string to find all occurrences of the pattern:
# Create a pattern to match names
name_pattern = re.compile(r'^([A-Z]{1}.+?)(?:,)', flags = re.M)
# Find all occurrences of the pattern
names = name_pattern.findall(content)

Like I said, the pattern is pretty complex, but it does exactly what we want! Don’t worry about the details of the pattern, but just think about the general process: first define a pattern, and then search a string to find the pattern.
We repeat the procedure with the colleges and the salary:
# Make school patttern and extract schools
school_pattern = re.compile(r'(?:,|,\s)([A-Z]{1}.*?)(?:\s\(|:|,)')
schools = school_pattern.findall(content)
# Pattern to match the salaries
salary_pattern = re.compile(r'\$.+')
salaries = salary_pattern.findall(content)

Unfortunately the salary is in a format that no computer would understand as numbers. Fortunately, this gives us a chance to practice using a Python list comprehension to convert the string salaries into numbers. The following code illustrates how to use string slicing, split , and join, all within a list comprehension to achieve the results we want:
# Messy salaries
salaries = ['$876,001', '$543,903', '$2453,896']
# Convert salaries to numbers in a list comprehension
[int(''.join(s[1:].split(','))) for s in salaries]

[876001, 543903, 2453896]
We apply this transformation to our salaries and finally have the all info we want. Let’s put everything into a pandas dataframe. At this point, I manually insert the information for my college (CWRU) because it was not in the main table. It’s important to know when it’s more efficient to do things by hand rather than writing a complicated program (although this whole article kind of goes against this point!).

Subset of Dataframe
Visualization
This project is indicative of data science because the majority of time was spent collecting and formatting the data. However, now that we have a clean dataset, we get to make some plots! We can use both matplotlib and seaborn to visualize the data.
If we aren’t too concerned about aesthetics, we can use the built in dataframe plot method to quickly show results:
# Make a horizontal bar chart
df.plot(kind='barh', x = 'President', y = 'salary')

Default plot using dataframe plotting method
To get a better plot we have to do some work. Plotting code in Python, like regular expressions, can be a little complex, and it takes some practice to get used to. Mostly, I learn by building on answers on sites like Stack Overflow or by reading official documentation.
After a bit of work, we get the following plot (see notebook for the details):
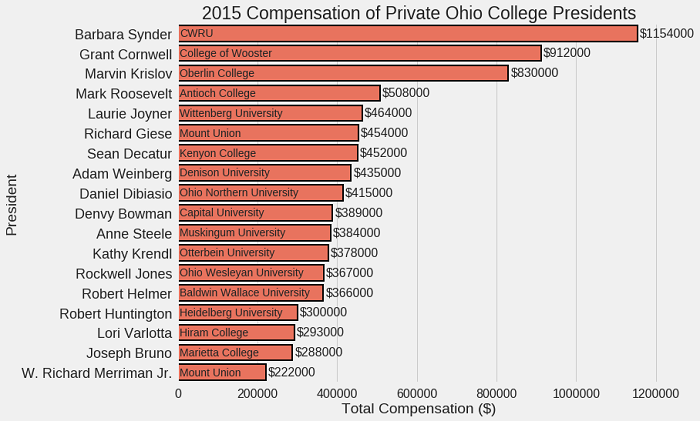
Better Plot using seaborn
Much better, but this still doesn’t answer my original question! To show how much students are paying for 5 minutes of their president’s time we can convert salaries into $ / five minutes assuming 2000 work hours per year.
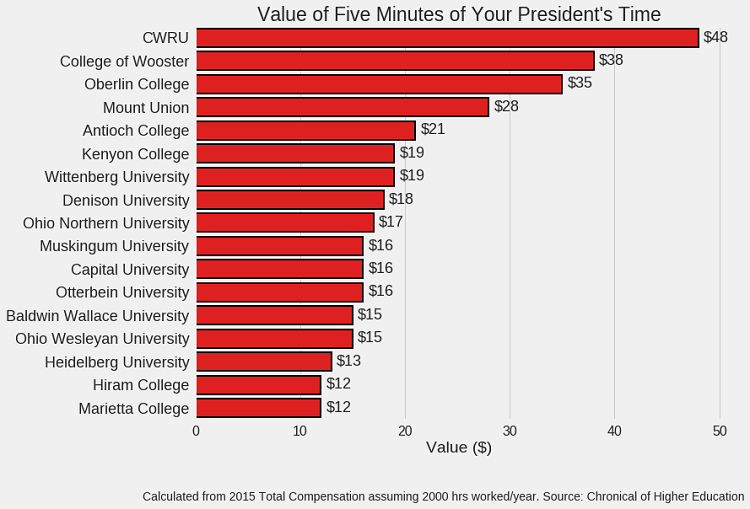
Final Figure
This is not necessarily a publication-worthy plot, but it’s a nice way to wrap up a small project.
Conclusions
The most effective way to learn technical skills is by doing. While this whole project could have been done manually inserting values into Excel, I like to take the long view and think about how the skills learned here will help in the future. The process of learning is more important than the final result, and in this project we were able to see how to use 3 critical skills for data science:
- Web Scraping: Retrieving online data
- Regular Expressions: Parsing our data to extract information
- Visualization: Showcasing all our hard work
Now, get out there and start your own project and remember: it doesn’t have to be world-changing to be worthwhile.
#python #machine-learning #data-science #web-development