In Spark SQL the query plan is the entry point for understanding the details about the query execution. It carries lots of useful information and provides insights about how the query will be executed. This is very important especially in heavy workloads or whenever the execution takes to long and becomes costly. Based on the information from the query plan we may find out what is not efficient and decide to rewrite part of the query to achieve better performance.
For someone not familiar with query plans, at first sight, the information may look a bit cryptic. It has a structure of a tree and each node represents an operator that provides some basic details about the execution. The official Spark documentation which is otherwise nicely written and very informative becomes insufficient when it comes to execution plans. The motivation for this article is to provide some familiarity with the physical plans, we will take a tour of some of the most frequently used operators and explain what information they provide and how it can be interpreted.
The theory presented here is based mostly on the study of the Spark source code and on the practical experience with running and optimizing Spark queries on daily basis.
Basic example setup
For the sake of simplicity let’s consider a query in which we apply a filter, carry out an aggregation, and join with another DataFrame:
# in PySpark API:

query = (
  questionsDF
  .filter(col('year') == 2019)
  .groupBy('user_id')
  .agg(
     count('*').alias('cnt')
  )
  .join(usersDF, 'user_id')
)
You can think about the data in this example in such a way that usersDF is a set of users that are asking questions that are represented by _questionsDF. _The questions are partitioned by the year column which is a year when the question was asked. In the query, we are interested in questions asked in 2019 and for each user, we want to know how many questions he/she asked. Also for each user, we want to have some additional information in the output, that is why we join with the _usersDF _after the aggregation.
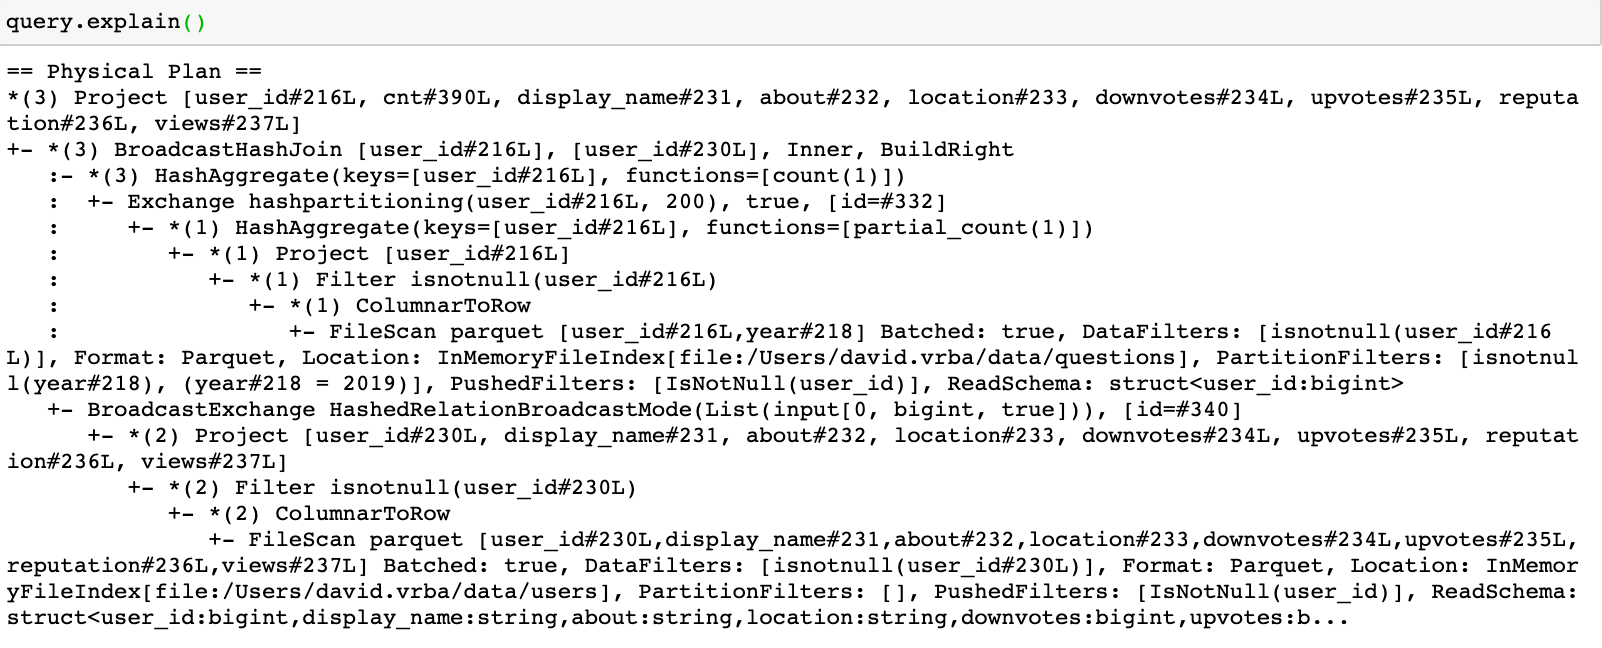
There are two basic ways how to see the physical plan. The first one is by calling explain function on a DataFrame which shows a textual representation of the plan:
#apache-spark #spark-sql #apache