Learn how to analyze your gambling results using vectors in R. Learn to create vectors in R, name them, select elements from them, and compare different vectors.

Let’s take a trip to a Statisticians Paradise, otherwise known as Vegas!
Thanks to R and your new data analytical skills, you will learn how to uplift your performance at the tables and make some profits. After this tutorial, you will be able to easily track your betting progress and analyze your past action.
Create a Vector
Vectors are one-dimensional arrays that can store numeric data, character data, or logical data. They are a simple tool to store data. For example, you can store your daily gains and losses in the casinos.
In R, you create a vector with the combine function [**c()**](https://www.rdocumentation.org/packages/base/versions/3.6.2/topics/c).You place the vector elements separated by a comma between the parentheses. For example:
numeric_vector <- c(1, 2, 3)
character_vector <- c("a", "b", "c")
Once you have created these vectors in R, you can use them to do calculations.
For you to try
Create a vector that contains the three elements: TRUE , FALSE , and TRUE (in that order)
Solution
boolean_vector <- c(TRUE, FALSE, TRUE)
For you to try (2)
After a week in Vegas, you still aren’t rolling in dough. So, you decide to start using your new data analysis skills.
Before doing an analysis first, you decide to collect the outcomes for the last week:
For Poker:
- On Monday you won $140.
- Tuesday you lost $50.
- Wednesday you won $20.
- Thursday you lost $120.
- Friday you won $240.
For Roulette:
- On Monday you lost $24.
- Tuesday you lost $50.
- Wednesday you won $100.
- Thursday you lost $350.
- Friday you won $10.
You only played poker and roulette. Assign the winnings/losses to variables.
Solution
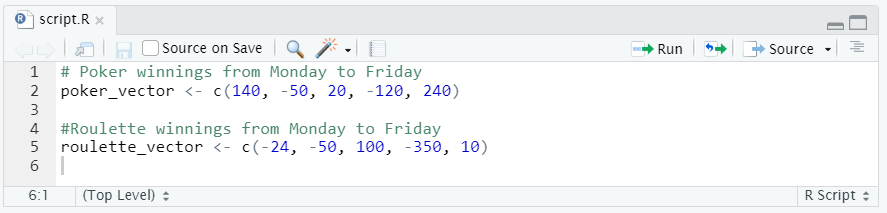
# Poker winnings from Monday to Friday
poker_vector <- c(140, -50, 20, -120, 240)

# Roulette winnings from Monday to Friday
roulette_vector <- c(-24, -50, 100, -350, 10)
#data-sceince #r #data-analytics-tools #data-analytics #data-analysis #data analysis