
I have already written some blogs on Elastic Stack where I have explained different components of Elastic Stack and also some use cases where we can import data from different sources like CSV, MySQL, and MongoDB etc. I was getting different questions and chat messages from different users regarding “what is Kibana” and “how we can use Kibana”. As it is the first step if you want to start using the Elastic Stack through the web interface of Kibana. So here in this blog, I am going to explain the basics of Kibana, its use case, and how we can create the index patterns in Kibana to use the Elasticsearch index data. So now without wasting any time lets start with the introduction to Kibana.
Kibana is a dashboarding tool that works very closely with the Elasticsearch. Kibana can be used for different use cases, such as system monitoring and application monitoring. In a traditional monitoring system, you can monitor system performance, application logs, and so on. But with Kibana and Elastic Stack, we can do a lot of things, please mention to the below points:
- We can create alerts for certain threshold values so that we can get alerts without doing a continuous monitoring
- We can configure different Beats to monitor system metrics, database metrics, and log metrics, etc.
- We can configure the APM to monitor the application metrics and any application related issues.
- We can Configure the JDBC plugin of Logstash to pull RDBMS, CSV, or NoSQL data into Elasticsearch to make it available in Kibana for creating visualizations on different KPIs
- We can use different third-party plugins that help us to get data from different sources. For example, we can use the Twitter plugin to get the Twitter feeds
- We can apply machine learning on our data set to find any data anomaly or future trends by analyzing the current dataset
These were some of the use cases where we can use Kibana. As I have mentioned that Kibana works very closely with Elasticsearch but I forgotten to mention that** it only works with Elasticsearch **as of now. The Elasticsearch data is not available automatically in Kibana and if we want to use the Elasticsearch index data then we need to create the index pattern in Kibana for the Elasticsearch index. Now let us cover how to create the index pattern in Kibana for an Elasticsearch index.
Creating the index pattern:
Take an example of an Elasticsearch index “users” where we have the user details, please refer to the below example:
{
  "_index" : "users",
  "_type" : "_doc",
  "_id" : "1",
  "_score" : 1.0,
  "_source" :
  {
     "name" : "Anurag Srivastava"
  }
}
The above example is showing a document of the “users” index of Elasticsearch. Now if we want to create the index pattern in Kibana then we need to do the following:
- Click on the “Management” link from the left menu on Kibana UI. This will open the management page of Kibana.
- Now click on the “Index Patterns” link under the “Kibana” heading. This will open the Index Patterns page of Kibana.
- Click on the “Create index patterns” button on the top right corner this will open the “Create index pattern” page with step 1 of 2 “define index pattern”.
- In the index pattern, text box types the name of the index “users” to match the index users.
- Also if we want to match more than one index through a single index pattern then we can type the name along with a wildcard. Like if we type “user*” then it will match with the user, users, and user_details index. Please refer to the below screenshot:
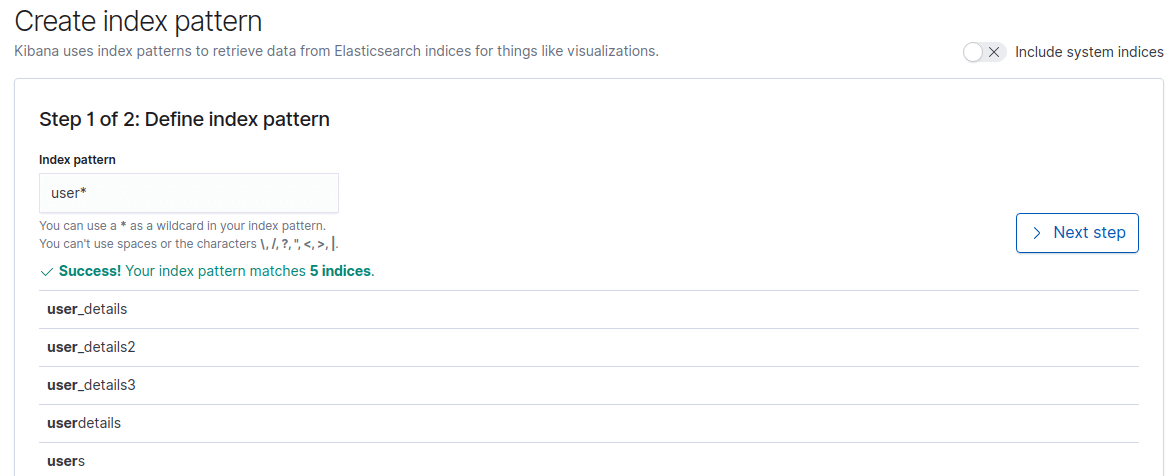
- In any case, if it matches any index then we will get the success message and the “next step” button will get enable.
- In the next step, we can do some settings like custom index pattern id. If we want Kibana to set it for us then we can click on the “Create index pattern” button.
- This will create the “users” index pattern and will show the field details along with the option to edit different fields. Here we can set the format of the field. Please refer to the below screenshot:

- We can verify the index pattern by clicking on the “Discover” link from the left menu and then we can select the index pattern from the drop-down, please refer to the below screenshot:

#monitoring #visualization #kibana #elasticsearch #elk
