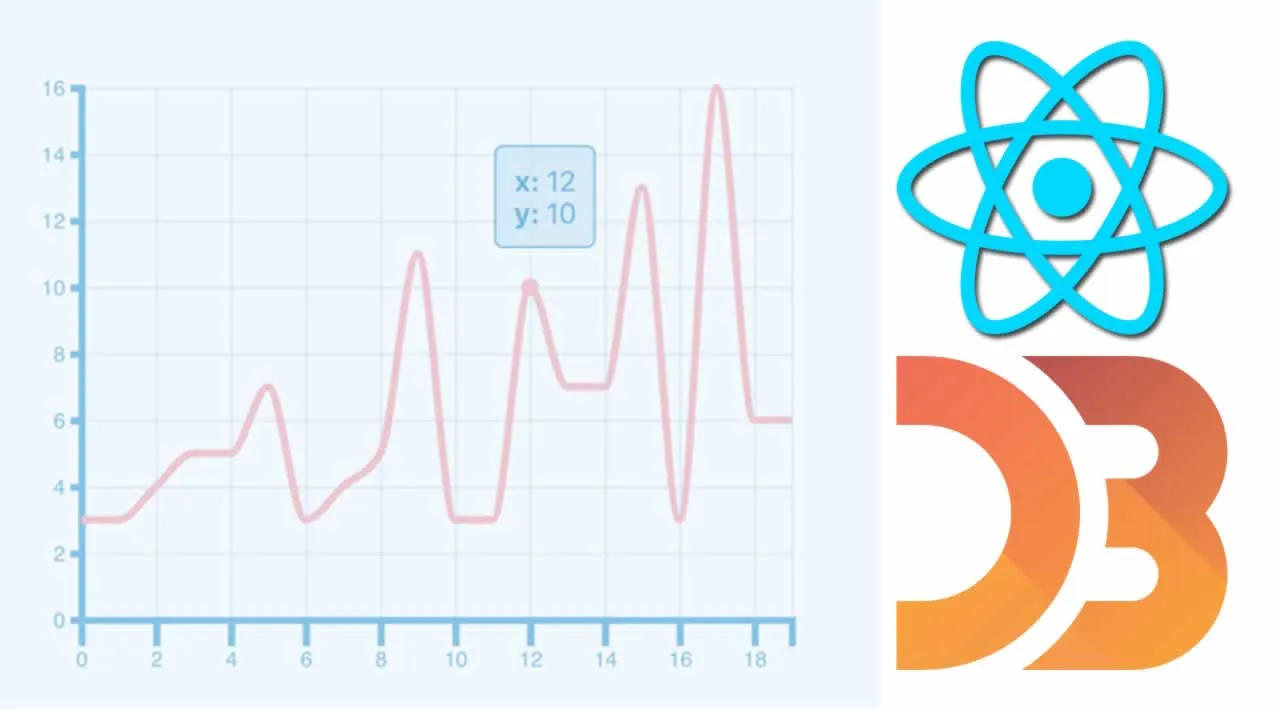
D3.js is a data visualization library that is used to create beautiful charts and visual representations out of data using HTML, CSS, and SVG. You can plot and choose from a wide variety of charts such as treemaps, pie charts, sunburst charts, stacked area charts, bar charts, box plots, line charts, multi-line charts, and many more. You can check out the gallery here.Today, we will be creating a simple (but cute) line chart with tooltips in React using D3.
Prerequisites
- Create a new React app if you don’t have one already.
- Add D3 v5.16.0 as a dependency.
#d3js #data-visualization #react #javascript
4.25 GEEK