Previously, I’ve explained how to take a column of delimited data and extract the individual values into their own rows in Power Query (Excel and Power BI) and in Python (pandas).
Today I am expanding this mini-series by explaining how these data transformations can be achieved in R.
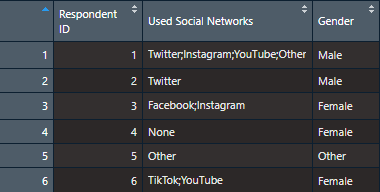
Once again I’ll make use of this social network usage sample data to demo the transformations.
Sample data
The objective is to take the above inital data (loaded from a CSV file) and transform it to the following form:

Resulting data
As an extra, I will also show you how to visualize the frequency of the social networks in a bar chart, with Plotly.
If you wish to skip the explanations and jump directly to the code, feel free to visit my GitHub repository where I have all the code and sample data.
Split and unpivot data
The main focus of this demo is splitting and unpivoting the delimited data.
Sample data
We can see the “Used Social Networks” column can have multiple social networks in each row (maybe it was a multiple choice question in a survey), separated by semicolons (;). This isn’t a suitable format for data analysis, as we can’t count the frequency of each individual social network.
So, the logic for extracting the individual social networks and putting them on their own rows (unpivot) is as follows:
- Split the values of each row into their own column (e.g. Facebook;Instagram are split into two columns, one for Facebook, another for Instagram)
- Take those columns with individual options and put them in a single column (unpivot those columns)

Split and unpivot data transformations
(Notice how the data in the “Respondent ID” and “Gender” columns is repeated to make sure the social networks are still respective to their respondent)
#programming #data-science #data-analysis #r #data-visualization #data analysis