In this post, i am going to try to answer that **Where should I buy new property for investment in London? **This is my first project at Istanbul Data Science Academy about Exploratory Data Analysis (EDA).

At the beginning of my project, I would like to explain What is Exploratory Data Analysis(EDA)?
What is Exploratory Data Analysis
“Exploratory Data Analysis is a detective work. EDA can never be the whole story, but nothing else can serve as the foundation stone — as the first step ” –John W. Tukey, 1970
Exploratory Data Analysis is a crucial step for all data science projects. In real world problems, data never ever used directly to your data science projects. Collecting datasets, cleaning, organising and wrangling data is critical process to develop your model. In this project, I spent nearly %80 of my time about collecting, cleaning, organising and wrangling data at my project.
Exploratory Data Analysis helps you that,
- understanding the structure of data ,
- handling missing values and outliers,
- recognising relationship beetween variables,
Briefly, Exploratory Data Analysis tell us almost everything about data.
Introduction to Project
Every data science project starts with a problem / question. In my project, my business need scenario is:
Finding best location to buy a new property that will be hosted on Airbnb for investment._ Constraints regarding this need are as follows:_
Total Budget : £750.000
Preferred Location: Inner London
My solution is : _Using __Airbnb London __data, __House Prices Index (House Price, Sales Volume, Yearly Increment) _data, Council Tax data, GIS Boundary data and analyse to find best location for buying new property.
My objectives about this project : Answering these questions for each borough;
- Number of properties_ that host on Airbnb_
- Average price_ per night_
- Estimate Occupancy rate
- Calculate annual income, annual expense, annual return, initial expense (tax, convenyacing,furniture etc.)
- _Calculate average house price, annual increment and _sales volume
- _Calculate _return of investment rate and total profit
You can see my workflow that I apply in this project below;

Exploratory Data Analysis (EDA) Work Flow
Data Sources and Tools
I obtained 2 types of data sources. One is Inside Airbnb data for detail property listing data. I decided to use the data for the 2019 to avoid being affected by the epidemic (covid-19). This dataset also include GeoJSON file of neighbourhoods of the city and airbnb properties location (latitude and longitude). So after my finishing analysing, I will be create some thematic maps.
Other data source is obtained from Mayor of London**. London Data Store has hundreds of dataset group by 18 topics. My focus dataset is “UK House Price Index” **located under **housing **topic.
My tools set is shown below;
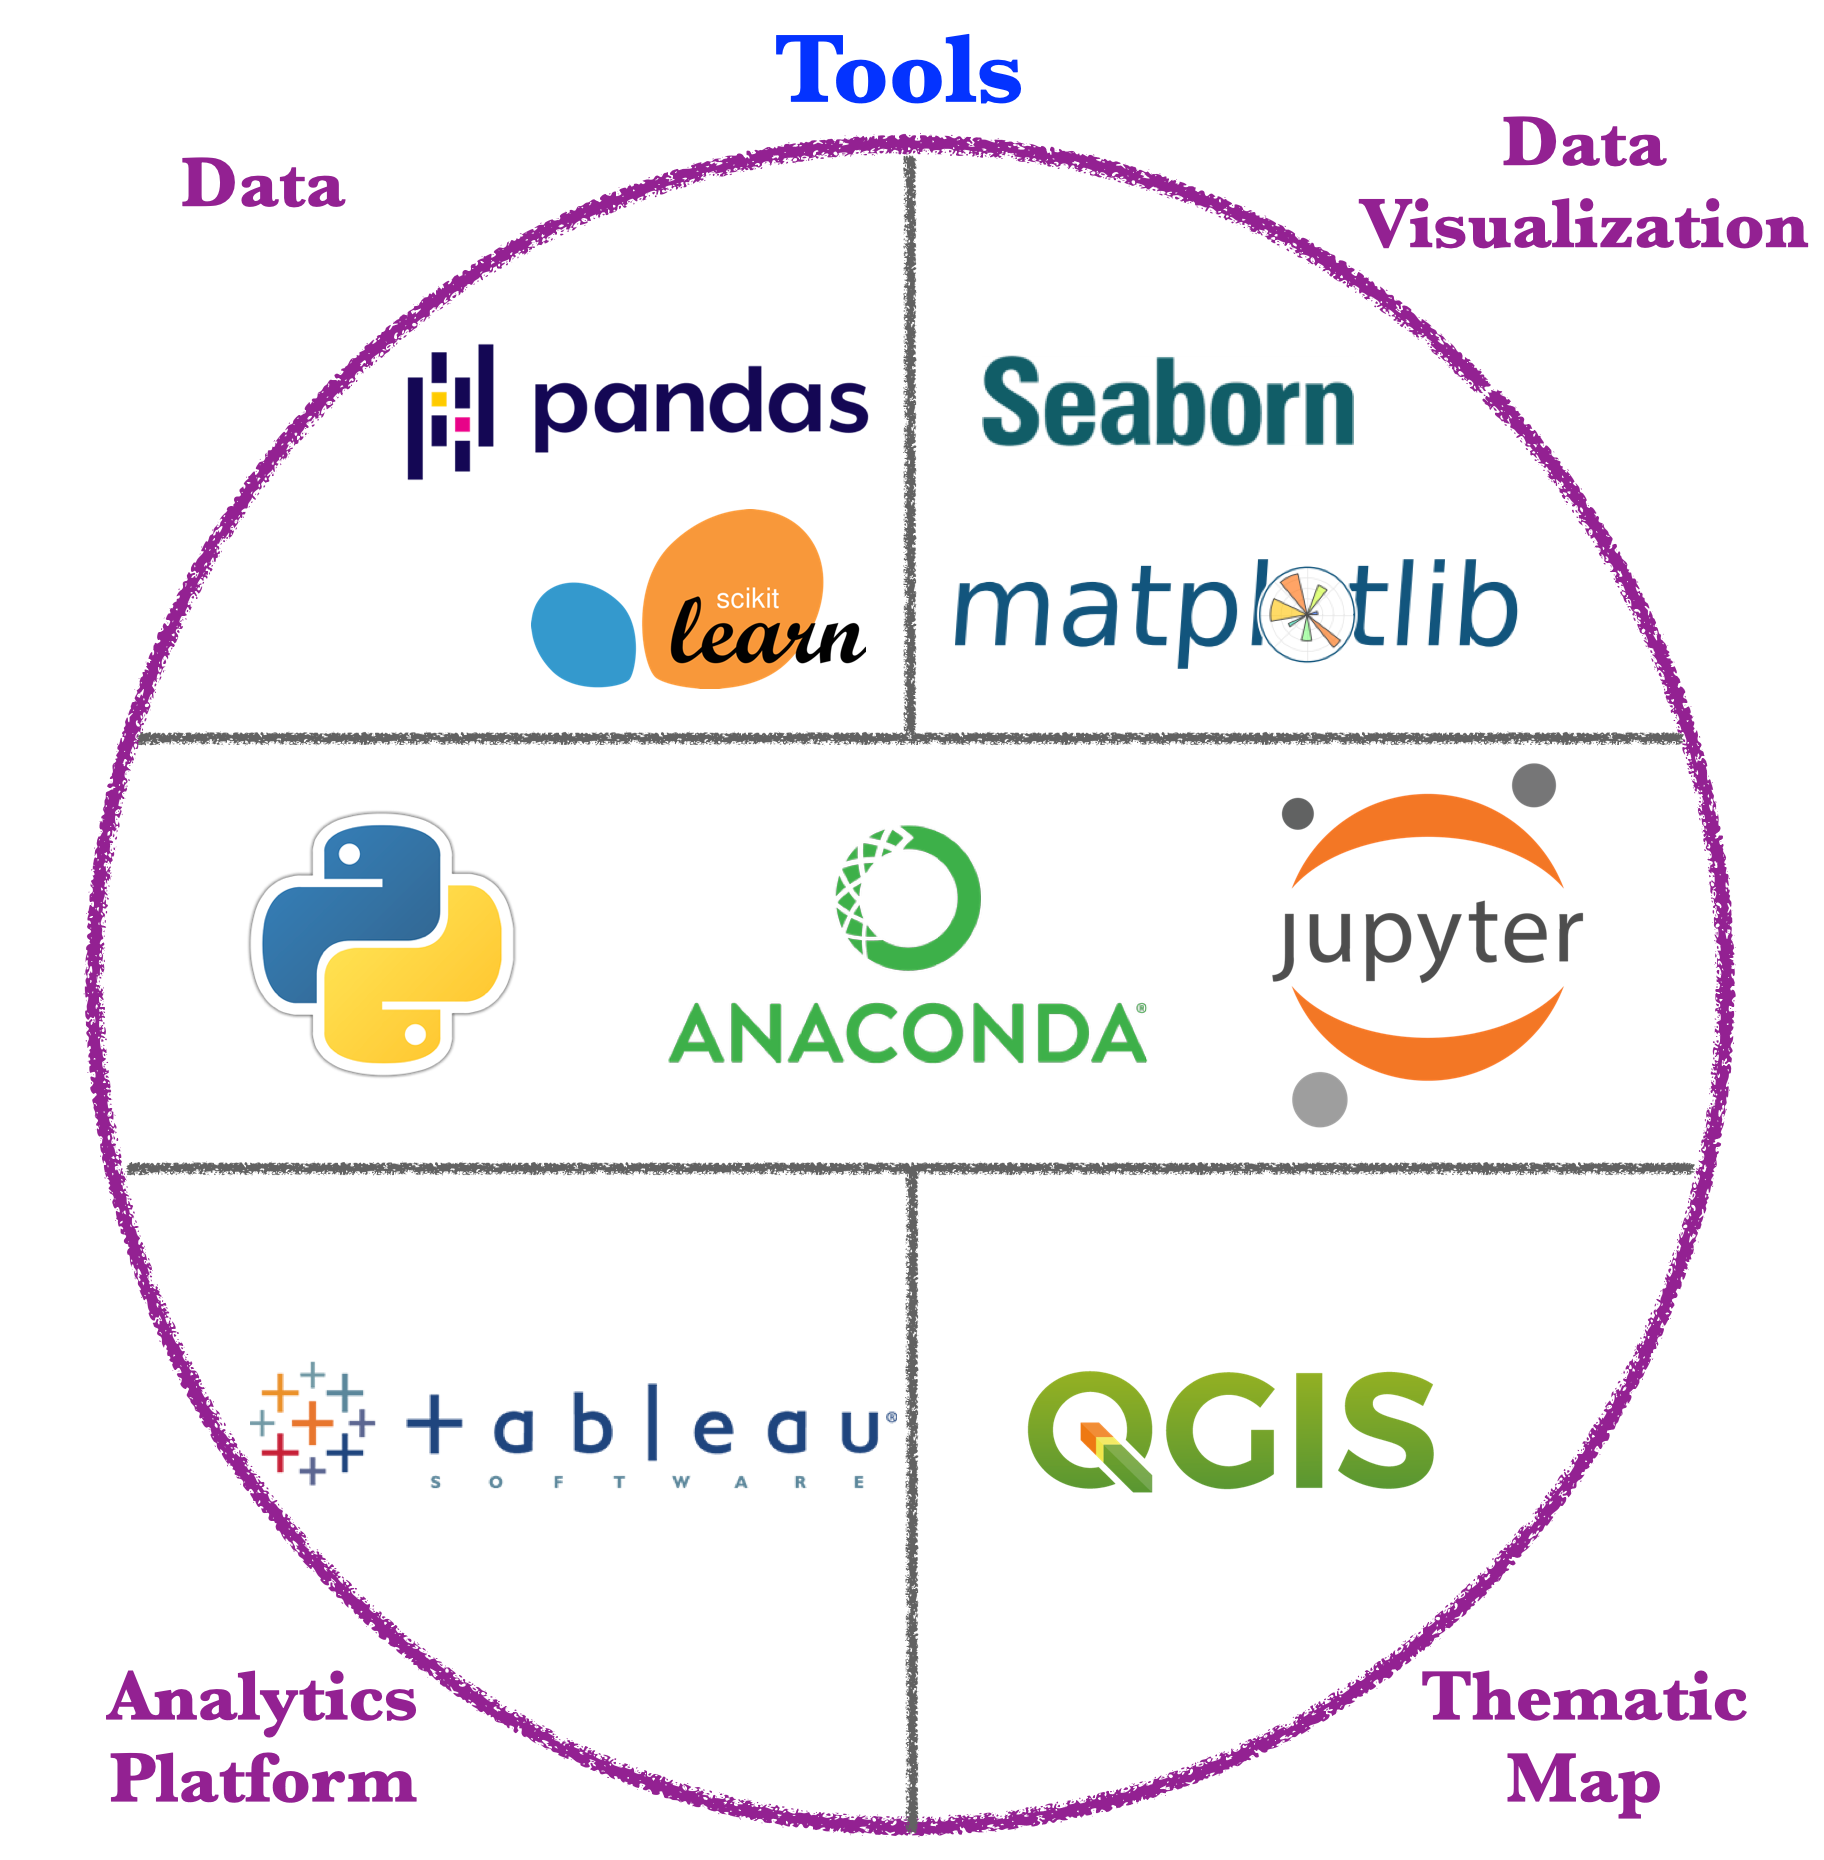
Tools used in Exploratory Data Analysis Project
I used;
- Jupyter Notebook on Anaconda distribution with Python Programming Language.
- Pandas and Scikit Learn libraries to data acquiring, cleaning and wrangling,
- Seaborn and Matplotlib libraries to data visualisation.
- QGIS to creating thematic map and spatial analysis.
- Tableau Public to analytics platform.
Data Wrangling and Analysing
Data Wrangling is a road from raw data to insights, report and visual graphs.
When you explore your data, you can use several inbuilt method that you need in Python such as info, shape, isnull, unique, count, describe, groupby, sort_values, pivot, merge etc.
#airbnb #data-scientist #data-analysis #london #data analysis
