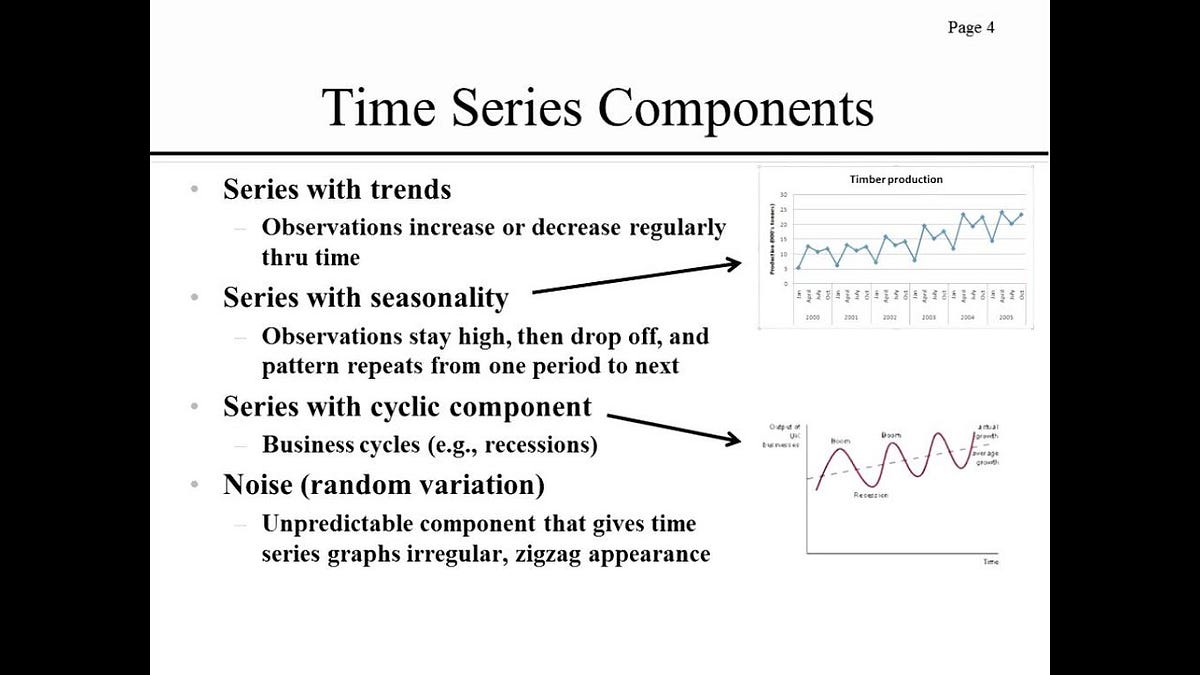
Time series analysis comprises methods for analyzing time series data in order to extract meaningful statistics and other characteristics of the data. Time series forecasting is the use of a model to predict future values .
In this article we are going to discuss about the results and the theory behind them based on ‘Predict Future Sales’ data set .
Note: to know every single details and detailed theory behind it please check this tutorial .
Introduction to Time Series Analysis and Forecasting - I
Data set Description:
we have:
- date — every date of items sold
- date_block_num — this number given to every month
- shop_id — unique number of every shop
- item_id — unique number of every item
- item_price — price of every item
- item_cnt_day — number of items sold on a particular day
Packages we need:
import warnings
import itertools
import numpy as np
import matplotlib.pyplot as plt
warnings.filterwarnings("ignore")
plt.style.use('fivethirtyeight')
import pandas as pd
import statsmodels.api as sm
from statsmodels.tsa.arima_model import ARIMA
from pandas.plotting import autocorrelation_plot
from statsmodels.tsa.stattools import adfuller, acf, pacf,arma_order_select_ic
import matplotlibmatplotlib.rcParams['axes.labelsize'] = 14
matplotlib.rcParams['xtick.labelsize'] = 12
matplotlib.rcParams['ytick.labelsize'] = 12
matplotlib.rcParams['text.color'] = 'k'
read the data:
df=pd.read_csv('sales_train.csv')

df.head()
Data types:
date               object
date_block_num      int64
shop_id             int64
item_id             int64
item_price        float64
item_cnt_day      float64
dtype: object
Now we have to convert “date” object to string (YYYY-MM-DD)
import datetime

df['date']=pd.to_datetime(df.date)
Visualizing the time series data:
ts=df.groupby(["date_block_num"])["item_cnt_day"].sum()

ts.astype('float')
plt.figure(figsize=(16,8))
plt.title('Total Sales of the company')
plt.xlabel('Time')
plt.ylabel('Sales')
plt.plot(ts)
#data-science-courses #timeseries-forecasting #artificial-intelligence #deep-learning #machine-learning #data analysis

1.80 GEEK