What Makes Queries Slow
Before we can optimize queries, we must understand what makes them slow, which operations or queries are expensive and what is it you actually want.
More Data = More Slow
That’s obvious right? The more data the query has to skim through, the longer it will take. So we must understand roughly how data is stored. And there is another major factor for making queries slow: cardinality. More on that below.
InfluxDB is a time-series database, which means it records data over time. It can handle nano seconds precision, meaning you can input metrics per nanosecond. Data will be stored with the precision you “enter” them.
An example: if you collect and report a single metric every 10 seconds, it will be stored “as-is”, so you will have 6 metrics per minute. In a year that is 3.1 million metrics. Now multiply that by the metrics you are collecting… It’s huge. The default RETENTION POLICY of InfluxDB is “forever”, so you’ll gather millions of records.
If you don’t aggregate, your metrics will be stored “raw” forever.
So this is great, right? You start using InfluxDB and input data and nothing gets lost. Nice! Yet after some time, the storage grows and grows as you add more metrics. Besides, the times you’ll look back half a year and are interested in metrics on a 10-seconds granularity are rare, very rare.
Check Your Database
Now let’s check what I’ve just said with your own database, assuming you’re reading this because you use InfluxDB.
There are two ways to check storage and cardinality of your InfluxDB. The first is simple, run queries.
1. Run Queries
Tipp: Use Grafanas “Explore” page to run single queries, to explore your database.
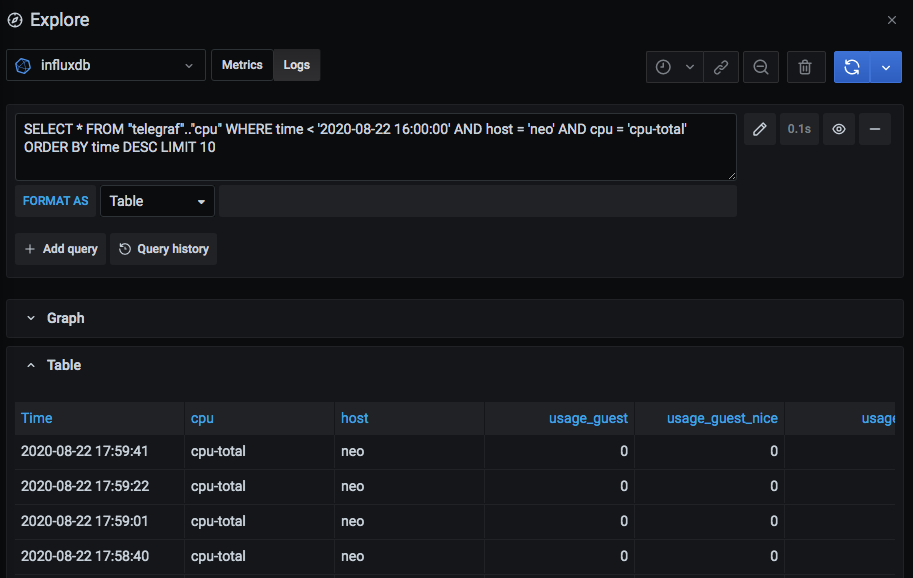
Check raw data from your measurements.
## show raw data from your measurements (at any point in time)
SELECT * FROM "cpu" WHERE time < '2020-08-01 00:00:00' ORDER BY time DESC LIMIT 10
Some Queries To Inspect Your Data
## show your measurements or how many you have
SHOW MEASUREMENTS
SHOW MEASUREMENT CARDINALITY

## show how many tags keys you have, optionally per measurement
SHOW TAG KEY CARDINALITY
SHOW TAG KEY CARDINALITY FROM "cpu"
## show or count different values of the tag key "host"
SHOW TAG VALUES CARDINALITY [FROM "cpu"] WITH KEY = "host"
SHOW TAG VALUES FROM "cpu" WITH KEY = "host"
## show how many fields you have in measurement "cpu"
SHOW FIELD KEY CARDINALITY FROM "cpu"
## show how many series you have in a database
SHOW SERIES CARDINALITY ON telegraf
## show or count different series in measurement "cpu"
SHOW SERIES CARDINALITY ON telegraf FROM "cpu"
SHOW SERIES ON telegraf FROM "cpu"
#influxdb #monitoring #grafana #software-engineering #devops