Bayesian updating — revising an estimate when new information is available — is a key concept in data science. It seems intuitively obvious that (within an accurate probability model of a real-world phenomenon) the revised estimate will typically be better. One simple and correct mathematical formulation of “better” is that the revision can only decrease the mean squared error of the estimate.
But there is a subtlety, seldom pointed out in textbooks, which is that the actual error, while often decreasing, typically does not decrease at every “new information” step. That is, the “picture always becomes clearer” analogy is misleading.
I will discuss this in the context of estimating the probability that a specified event will occur before a specified date. Suppose an expert first assesses the probability as 50%, then later at 60%, then later at 70%. It is very natural to perceive a trend and to presume that the probability is more likely to next increase to 80% rather than decrease to 60%. For many types of data — economic or social — such trends really do happen often. But probabilities don’t work that way!
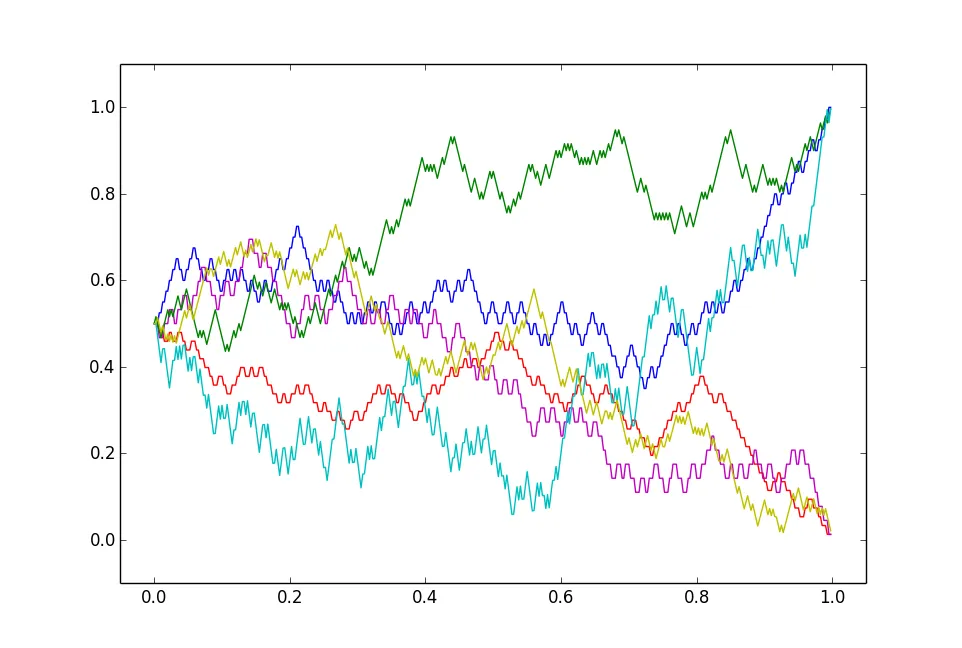
The three figures below indicate possibilities and impossibilities. Each figure shows 6 typical “realizations”, that is ways in which probabilities of a given event might change over time. We take the initial probability as 50% and make 3 of the realizations end at 1 (the event occurred) and the other 3 ends at 0 (the event did not occur).
#mathematics #probability #statistics #data-science
