Explore how to turn raw Covid-19 data into an interactive dashboard with Python and Tableau.
Introduction
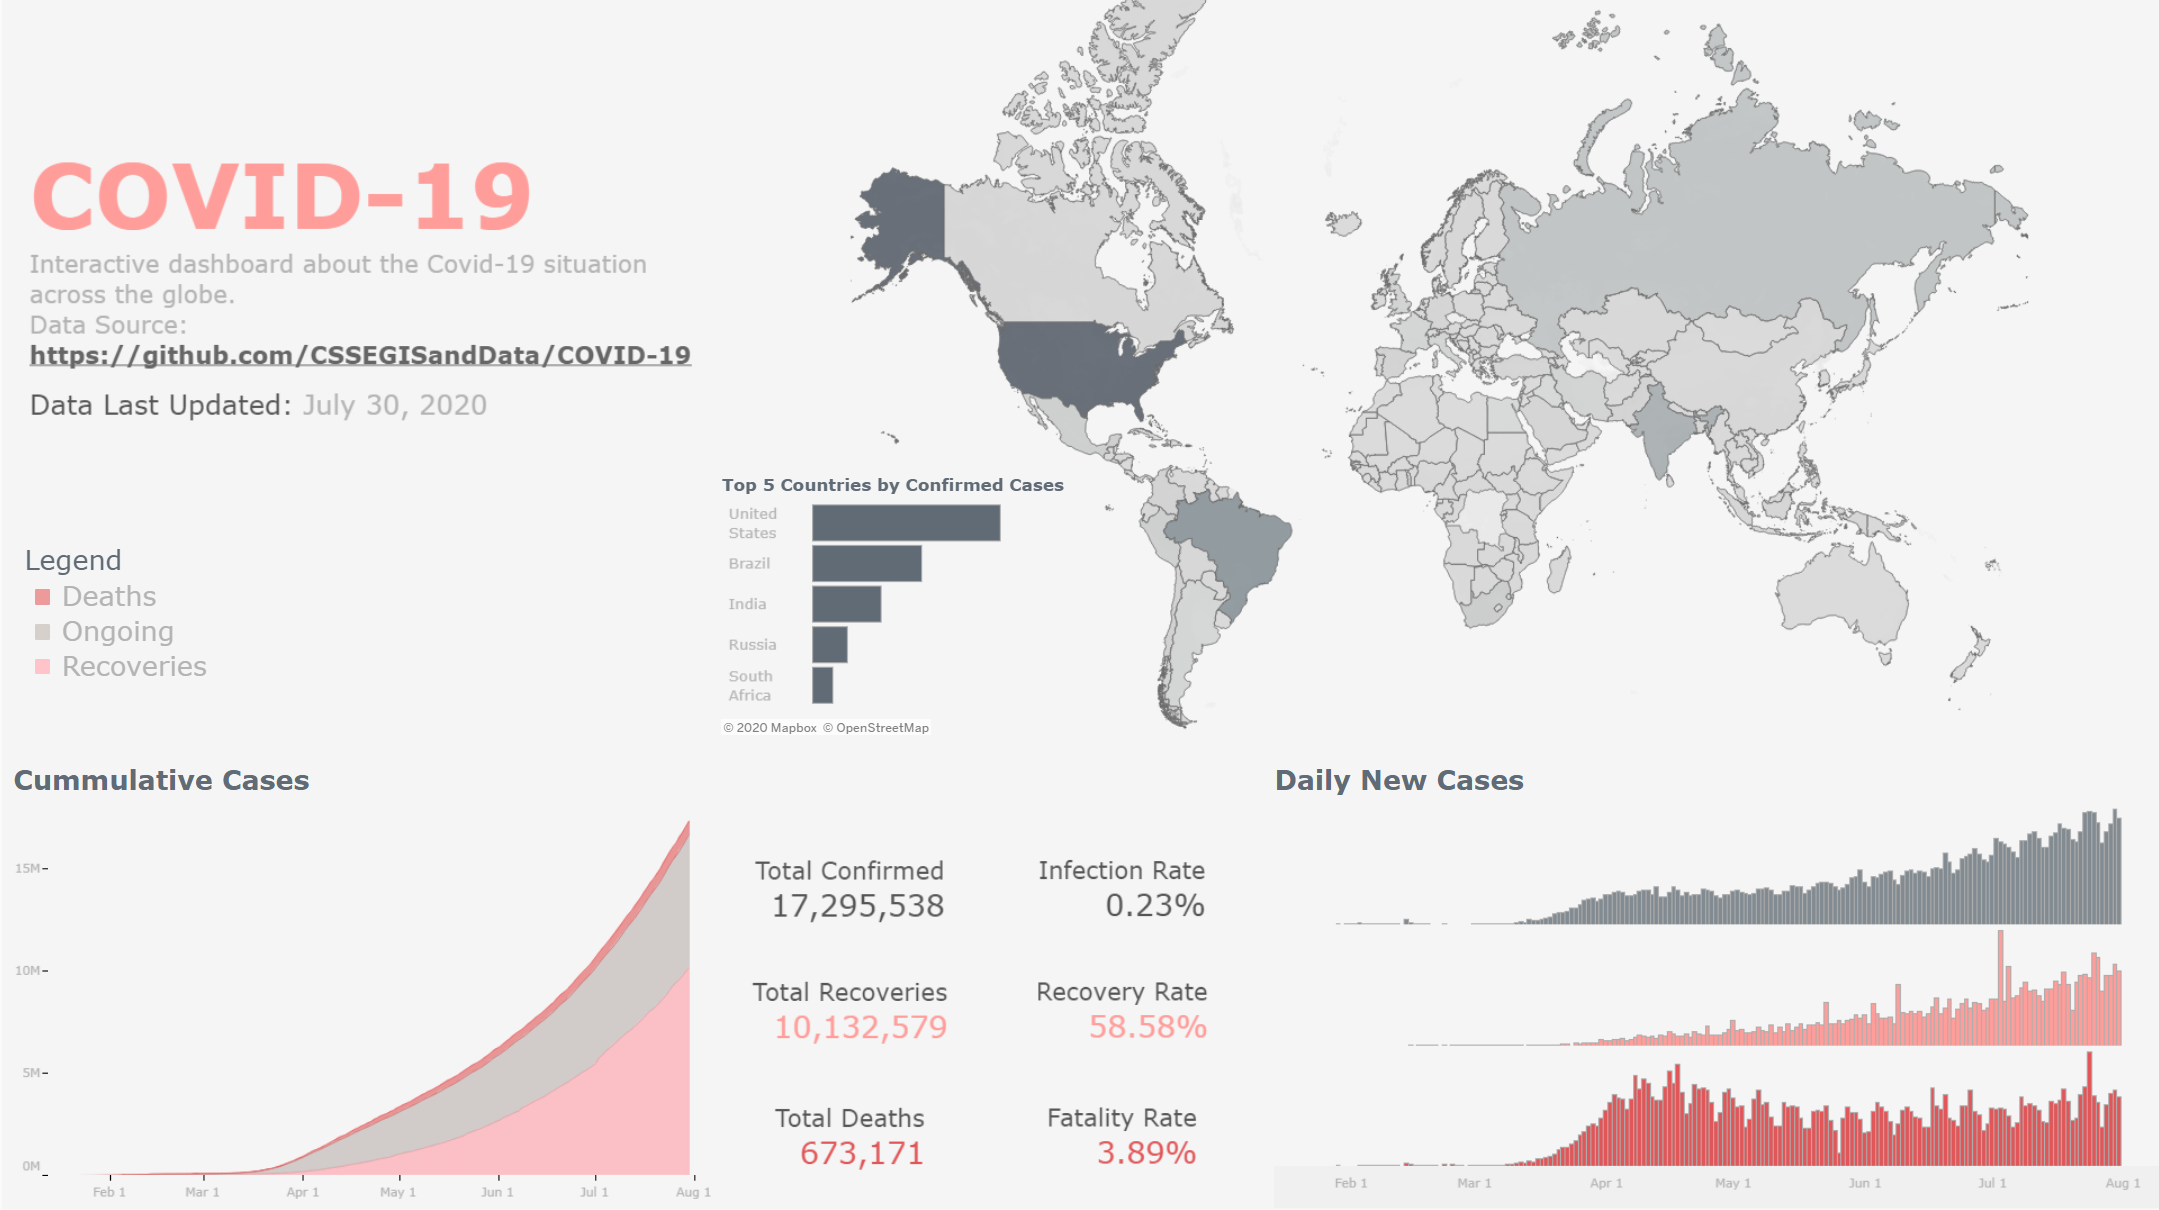
Months have passed since Covid-19 first made the headlines of major publishers. This deadly virus has only grown since, and caused tremendous damage to global health and economy. Attempts across the globe are being made to bring a stop to this pandemic and recover from its impacts. Being a tech-savvy and enthusiast in data science, I also want to join these efforts by creating an interactive dashboard to visualize the Covid-19 situation in the world.
In this article, I want to share my experiences in making this project. I will discuss about the steps in preprocessing data with Python, creating the Tableau dashboard as well as share the codes/workbook so that you can also create one on your own!
The dataset that I used in this project is the **COVID-19 Data Repository by the Center for Systems Science and Engineering (CSSE) at Johns Hopkins University (Source: Github). **This is probably one of the most comprehensive datasets publicly available about the Novel Coronavirus. It reports the number of confirmed, deaths and recoveries cases in 188 countries/regions around the world.
Data Preprocessing
Note: This section assumes you have some basic understandings of Python and Pandas. If you are not familiar with these, check out my previous article about Data Manipulation with Pandas to get started!
Transforming data from wide format to long format
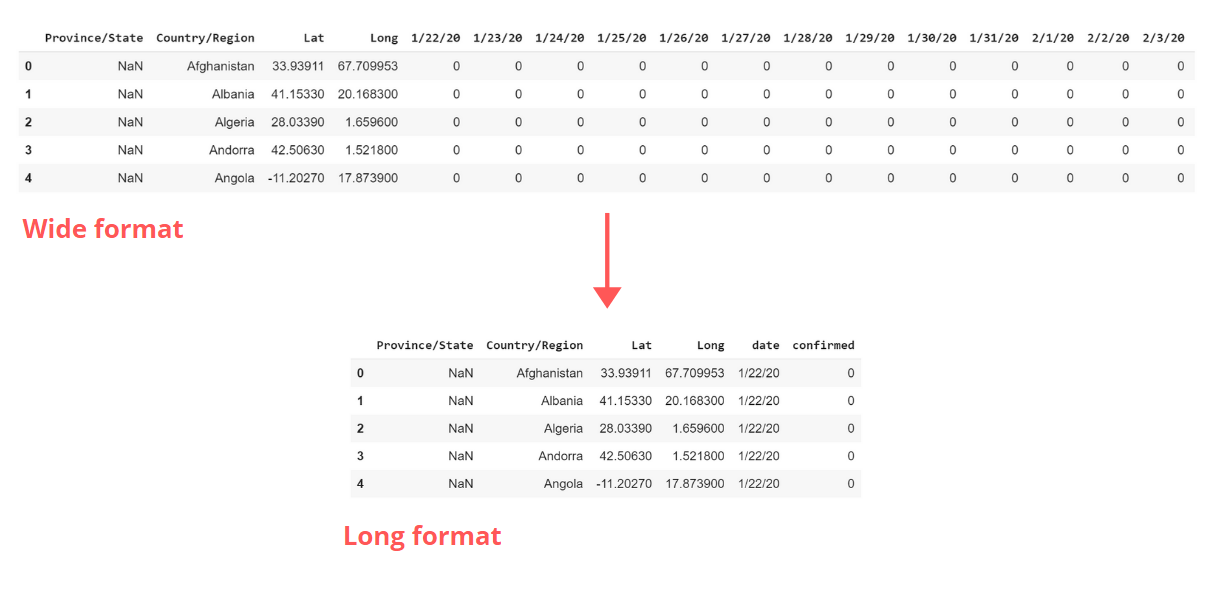
The CSSE Covid-19 dataset consists of three tables about daily confirmed, deaths and recoveries cases per country/region. Each table presents the data in wide (crosstab) format, with each day in a column. This format is very difficult to work with in Tableau so the first major preprocessing step is to pivot the data in these columns into rows (Long format).
Note that this operation can be done in Tableau with the Pivot function. However, Python is often my go-to choice for most preprocessing tasks because of its flexibility and speed when working large datasets.
Transforming from wide to long format can be done quite simple with Pandas function melt .
confirmed = pd.melt(confirmed, id_vars=confirmed.columns[:4],
	                    value_vars = confirmed.columns[4:],
	                    var_name = 'date',
	                    value_name = 'confirmed')
#python #data-visualization #data #tableau #covid19
