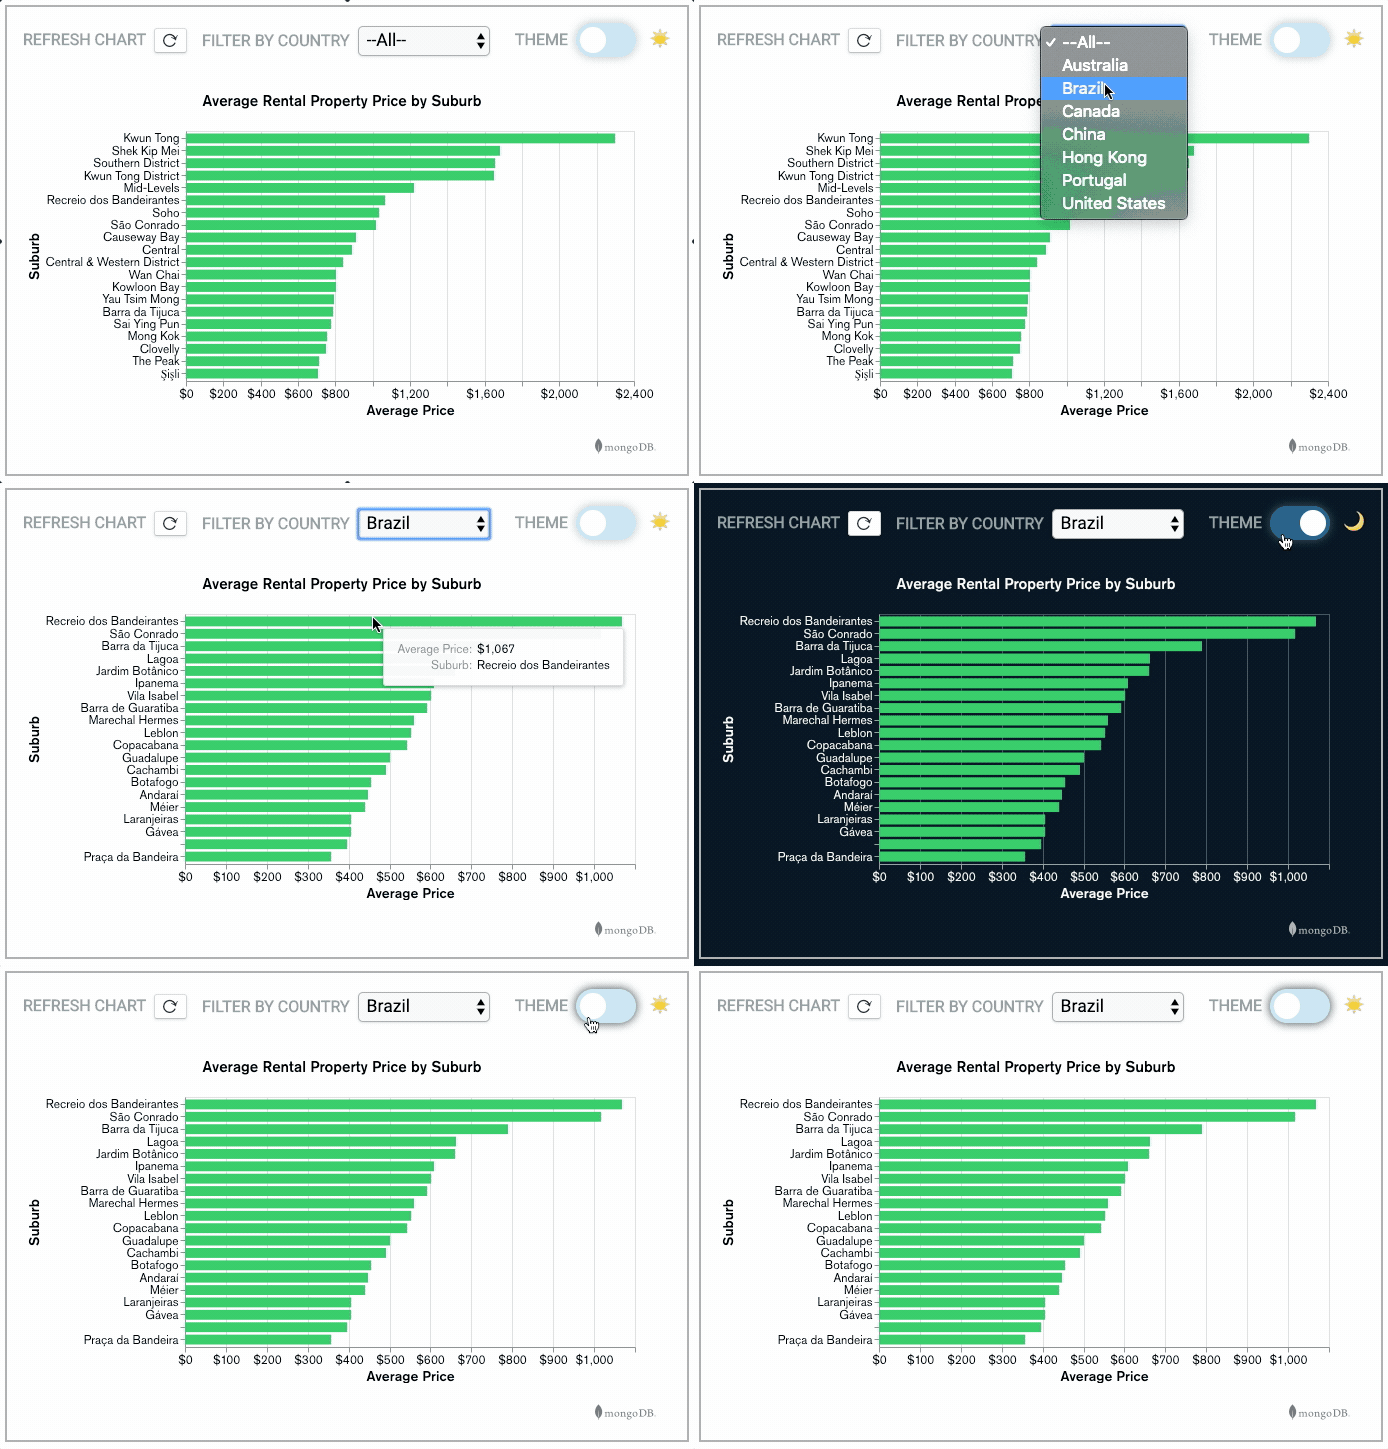
Charts are a great way of turning data into insights, and MongoDB Charts — part of the MongoDB Cloud platform — makes it super easy to build beautiful visualizations of data stored in MongoDB Atlas. Today we are excited to announce the general availability of the Charts Embedding SDK, giving developers a powerful new way to get beautiful data visualizations into their web apps.

The Embedding SDK is designed for Javascript developers who require more control of their embedded charts than is offered by the IFRAME-based embedding (which remains available as the simplest embedding option). As we discussed when we announced the beta a few weeks back, the Embedding SDK lets you take a chart authored with Charts and:
- Render it into a DOM element in your web page
- Choose from a light or dark theme
- Apply filters to the data in the chart
- Set an autorefresh period, or refresh the chart on demand.
The 1.0.0 release of the Embedding SDK builds on this functionality by providing a whole new solution for rendering sensitive charts into authenticated web apps, ensuring that the charts can only be viewed by the intended audience. Charts is able to validate existing sessions from apps using Google or MongoDB Stitch as their authentication mechanism, or you can integrate with any other authentication session that uses industry-standard JWT tokens.
In addition to checking that a session is valid, Charts is able to dynamically filter data on an embedded chart based on the properties of the user, as represented by claims in the token. For example, you could easily ensure that a sales rep can only see data from their own region, or that salary data is only available to managers and members of the HR team. If your app is built on MongoDB Stitch, your charts can even respect the data authorization rules built into your Stitch app.
Getting started with the MongoDB Charts Embedding SDK is easy:
- If you haven’t already done so, sign up for MongoDB Cloud, create an Atlas cluster, and activate Charts. You can do all of this for free!
- Load data into your cluster and use Charts to create some awesome data visualizations.
- Read the documentation on embedding charts with the SDK, and explore our sample apps
- Use the menus in Charts to enable embedding on the charts and data sources you want to use in your apps
- Use your development tooling to import the @mongodb-js/charts-embed-dom module from NPM and get coding!
#mongodb
