Often we are asked to find new insights about our customers. Sometimes we are given guidance, and sometimes we are told to develop something ‘new.’
I want to suggest severe weather as a layer of data. If a customer is experiencing an extreme weather event in their area, does their behavior change? Do they shop online, balance their investment asset allocations, read their emails, contact your call center, or sign up for new digital products? Do different weather events correlate to certain customer behaviors? Would you be able to predict future customer activity based on weather forecasts? Is there a business use case for this?
So your base data is your customer business data. ‘Flair’ is the weather data.
Weather data can be unruly, but I do have one source that has worked well for me. The National Centers for Environmental Information is a useful resource. You can download .csv files for the periods you want to analyze.
I took this information and loaded the file into Tableau Public. Tableau Public is free for you and me!
Here are some of the critical steps I took to animate the viz.
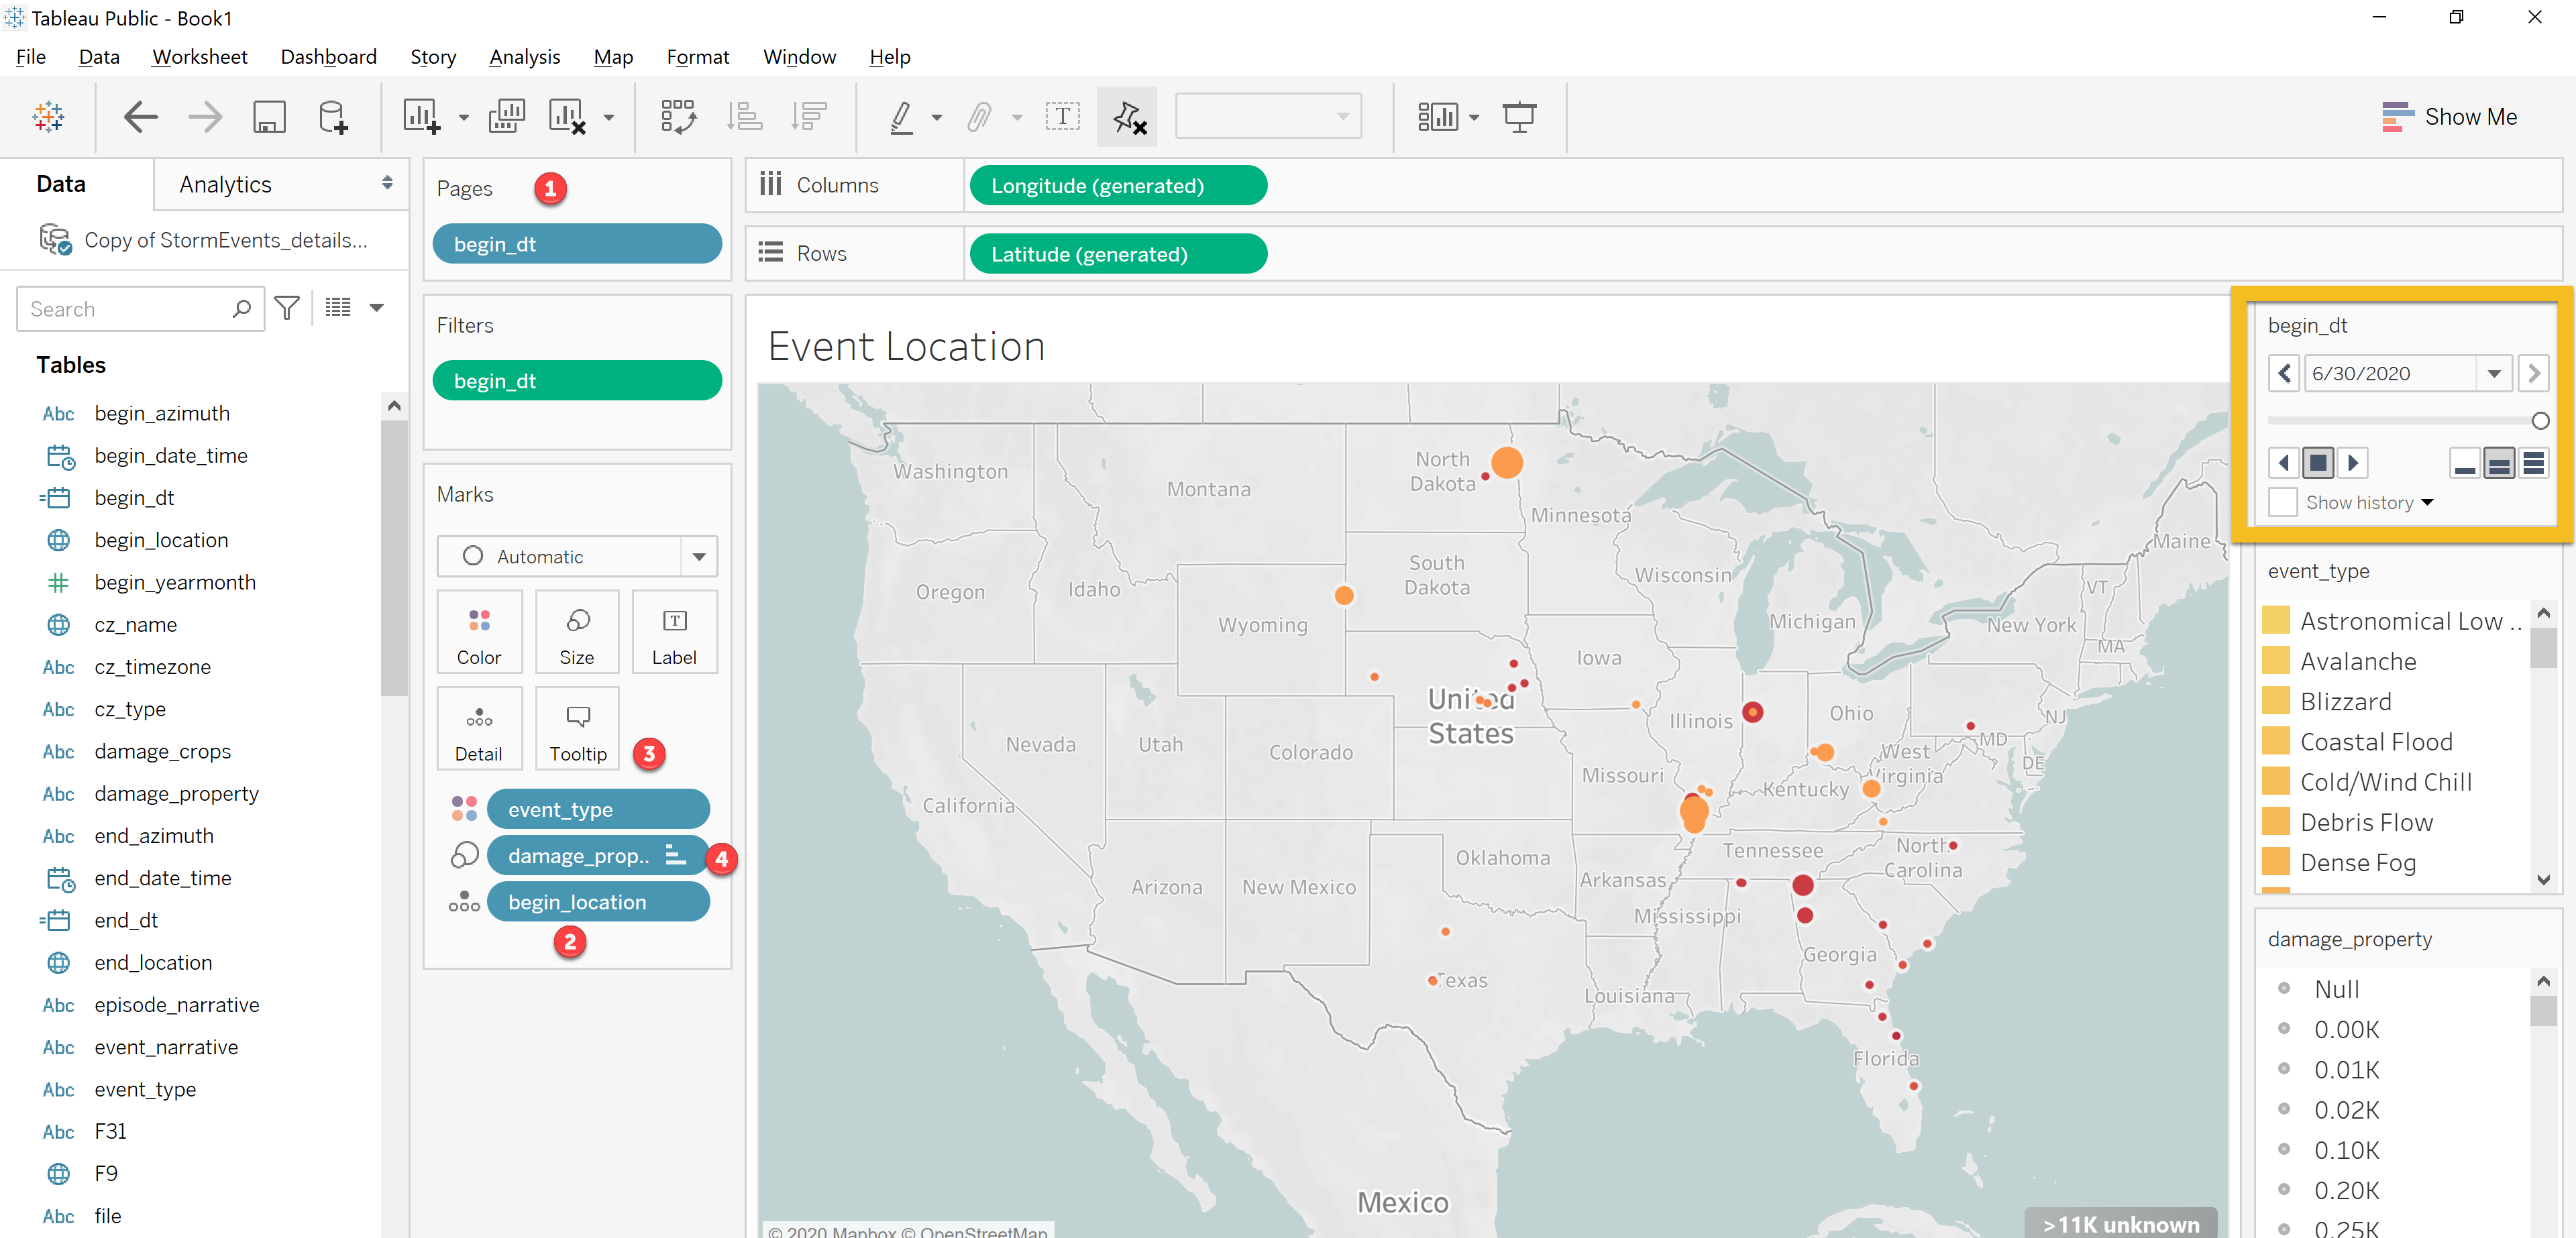
how to set up animation — screenshot by the author
- On the pages shelf, drop the data of the event. What this will do will add a special action box where you can hit play. Adding a date series will walk the data by the increment (in this case, day), displaying the requested data.
- To activate the map option, I added begin_location to the chart. This data places the location of the event on the map.
- I was interested in the event types. You can also add event types to the filter shelf to focus on particular situations such as tornados, floods, hurricanes, or blizzards.
- To add some element of severity, I dropped property damage into the size parameter. The higher the damage costs, the larger the circle.
Once you are ready to go, you hit the play button and what the weather in motion. There are times you can see the storm system moving from west to east right up the Appalachian Mountains.
#data-visualization #weather #tableau #data-science #customer-engagement
