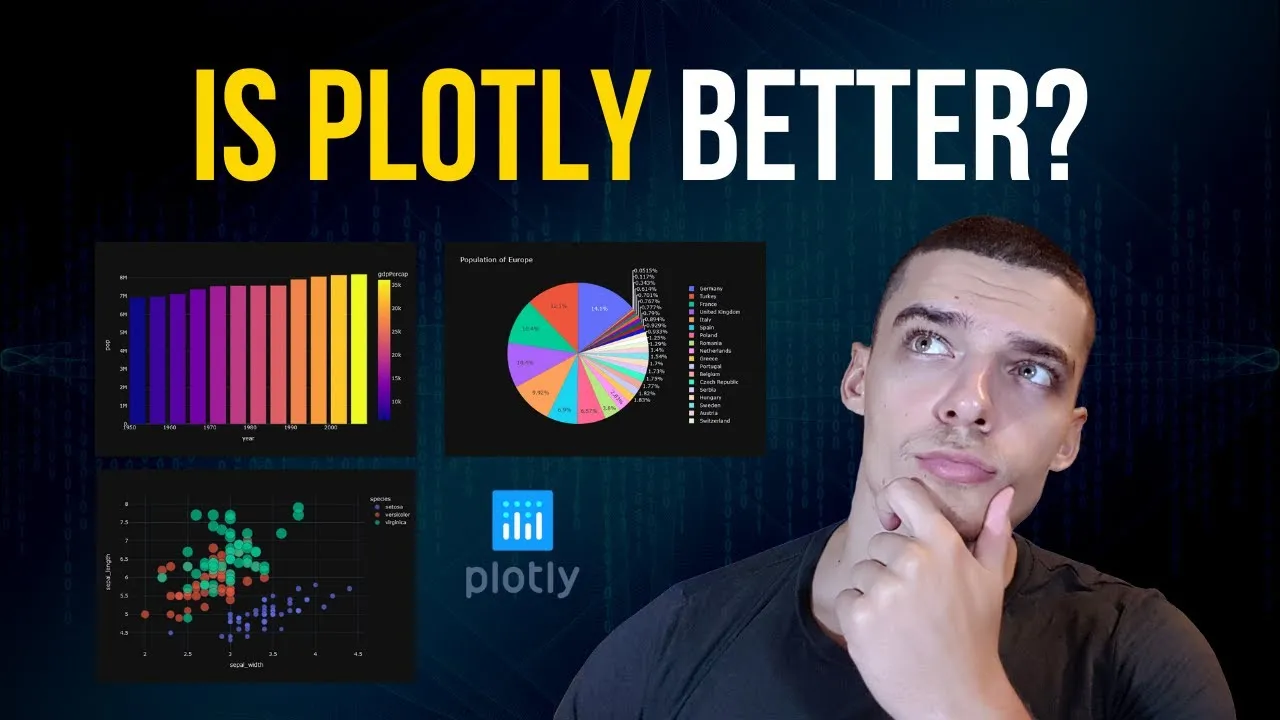
In this video we take a quick look at the Plotly framework in Python. At the end we compare it to Matplotlib.
Plotly is an open-source, interactive, and browser-based graphing library. It offers Python-based charting, powered by plotly.js. The library ships with over 30 chart types, including scientific charts, 3D graphs, statistical charts, SVG maps, financial charts, and more.
Matplotlib is a Python library for creating static, animated, and interactive visualizations. It is a popular choice for data visualization because it is easy to use and produces high-quality graphs.
Matplotlib is a comprehensive library that can be used to create a wide variety of graphs, including line charts, bar charts, scatter plots, histograms, and pie charts. It also supports a variety of customization options, so you can create graphs that look exactly the way you want them to.
Timestamps:
(0:00) Intro
(0:50) Development Environment
(6:01) Scatter Plots
(12:02) Line Plots
(14:35) Bar Plots
(18:34) Pie Plots
(19:55) Conclusion & Comparison
(22:25) Outro
📁 GitHub: https://github.com/NeuralNine
🎵 Outro Music From: https://www.bensound.com/
Subscribe : https://www.youtube.com/@NeuralNine/featured
#python #plotly #matplotlib
