Dashboards are user interfaces (UIs) that visualize data in an organized manner. Business dashboards usually contain information around Key Performance Indicators (KPIs) related to particular objectives or business processes. A dashboard is a “snapshot” report that allows us to display data at a given instant of time in a meaningful manner with the aid of charts for easy reference and quick inference.
Some attributes of a useful dashboard are:
- Customizable: An excellent dashboarding tool must allow users to customize according to need.
- Accessible: Should be available in a variety of media formats like web, mobile etc. for viewing on the go.
- Scalable: Should have the ability to add/change KPIs and add/change data sources.
Dashboards nowadays come in various shapes and sizes. Many companies roll out ready-made dashboarding services as SaaS. This software usually has workspaces where one can drag and drop data columns and KPIs. One of the most important dashboarding tools is Tabealu, which is self-contained software that allows users to build robust dashboards. However, if one might want to build their dashboarding tool, one would have to learn many technologies for visualization, database management and scripting. Below is a brief overview of some of the technologies involved (note this is not exhaustive):
Components of a dashboard Technologies
- Visualization D3, React JavaScript
- Database Management SQL, AWS, MongoDB
- Scripting R-shiny, Python, Java, Cpp
Using Python, we have several options at our disposal:
Dash: Dash is a powerful open-source library that helps build interactive and live web-based dashboards using Plotly, Flask and React.
Jupyter Dashboards: The dashboards layout extension is an add-on for Jupyter Notebook. It lets the user arrange notebook outputs in a grid or report like the format and saves this layout. The extension is required to be installed by other users to view this report.
Pyxley: Pyxlex is another excellent option for building dashboards. It leverages React and Flask. However, the support and documentation for this are limited.
Bokeh: A web dashboard tool that employs D3 and Tornado may require some knowledge of JavaScript.
Few more: Bowtie, Spyre, Superset
We go with Dash because:
- Easy to use: Built on Plotly and React, so it is straightforward to code and has many widgets available. All you need to know is Python; no need to learn React or D3. However, if you know React, then Dash allows you to plug into React’s extensive ecosystem through an included toolset that packages React components into Dash-useable components.
- Documentation: Dash is well documented and has a great and responsive community on Stack Overflow and Github.
Dashboarding in MVC
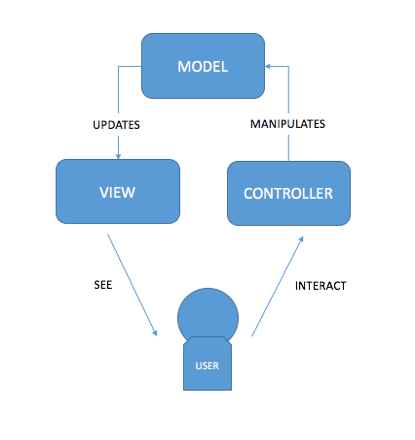
Most UIs follow an MVC framework, by MVC, we mean Model-View-Controller. Each interconnected component is built to take on a specific task in the development process.
Model: The model is the heart of the dashboard. The model gets the data from the database, manipulates it and stores it in objects which can later be consumed by the view.
Controller: Controller is how the user interacts with the dashboard. It usually requests the data from the model and presents it to the view.
View: The view is where data is present to the user or the frontend. A view oversees the visual part of the dashboard.
The MVC framework reduces the application’s complexity and makes it easier to maintain; for example, the developer can choose to change the UI without needing to change any backed code. We will look at Dash from an MVC perspective for more fundamental understanding.
#data-science #tutorial #data-visualization #python #dashboard