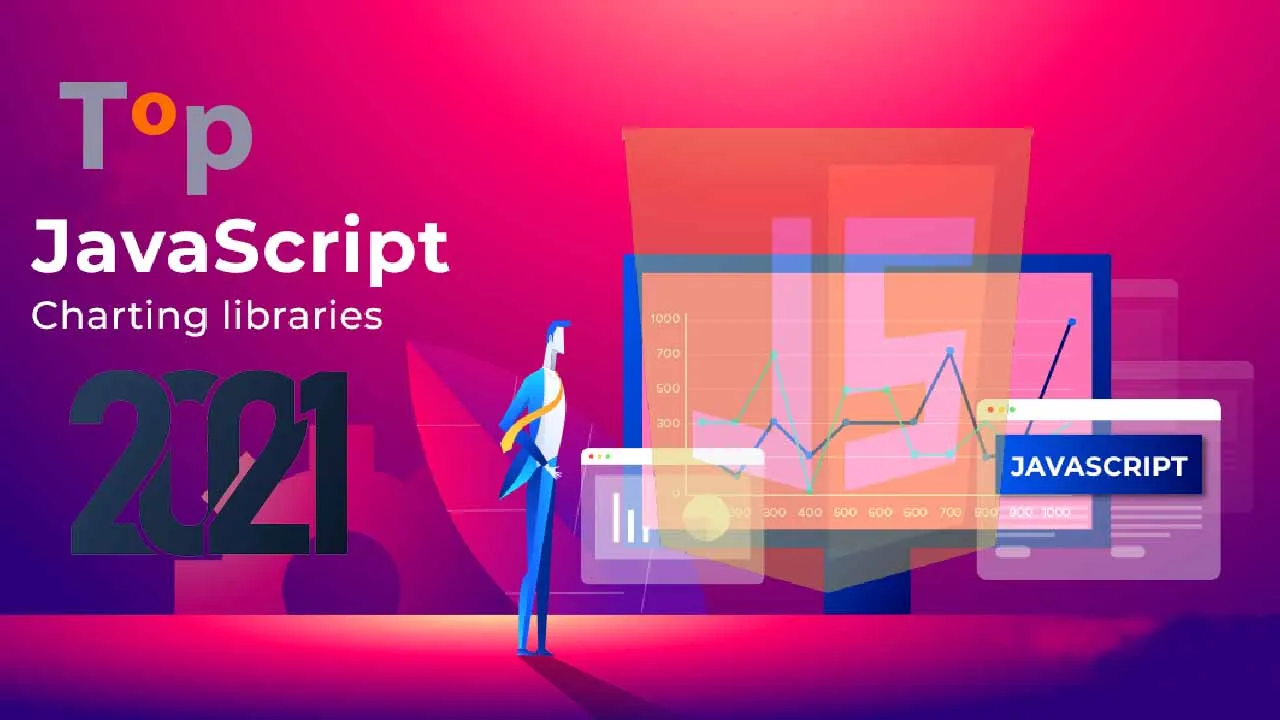
You must know these top 10 JavaScript libraries before kickstarting your next project.
Table of Content
- Introduction
- What is a JavaScript Chart Library?
- Top 10 JavaScript Chart Libraries of 2021
- Conclusion
With the constant increase in data collection and its usage, the need to visualize this data as a chart or table has become more important for every organization. Developers have to combine various database records to create a dashboard and charts that everyone can easily interpret. But with chart libraries coming into the picture, data visualization has become better. Now there are libraries and plugins that provide interactive charts. To learn more about this, go through this blog and see which are the libraries you can consider having the best charting experiences.
What is a JavaScript Chart Library?
The JavaScript chart library is nothing but a database visualization library that enables the developers to provide a graphical representation of the company’s data and important information. By using the visual elements of the library like graphs, maps, and charts, one can get access to see and understand the patterns, outliers, and trends of the data.
Top 10 JavaScript Chart Libraries of 2021
Here is the list of top JavaScript chart libraries that help organizations multiple data visualization options
1. Dygraphs
2. NVD3.js
3. ChartJS
4. Google Charts
5. Vis.js
6. Billboard.js
7. ApexCharts.js
8. ToastUI
9. Frappe Charts
10. AmCharts
#javascript-tips #java #chart-library #javascript