Introduction
Boston is the capital and the most populous city in the State of Massachusetts in the United States. Its economy, culture, history, and education attract hundreds-thousands of tourists each year. I have been eager to travel to this beautiful city so long and eventually make my plan this March. However, an unexpected global pandemic locks me down in NYC and delays my plan. After staying home, I have been planning the next trip to Airbnb Boston with data science techniques. I think that infuse data science into a trip plan would be more scientific and interesting. If you are interested, you can also consider this blog as a funny and may-be insightful guidance for your next trip to Boston.
The open dataset I will use coming from here and complied on 10 June 2020. The original dataset consists of 3440 listings, 16 features of Airbnb across 25 Boston neighborhoods. In this post, I will provide you with data visualization and machine learning solutions for three main questions that you would care about: Location: What regions do you have more choice or you are more likely to stay in Boston Airbnb? Room Type: What types of rooms are most popular for stay? Price: What are the important features to influence price? Could you predict the price of Boston Airbnb?
Preliminary Data Visualization
Firstly, I review paired relations using seaborn. Which provides general information and patterns among 9 usefully numerical features.
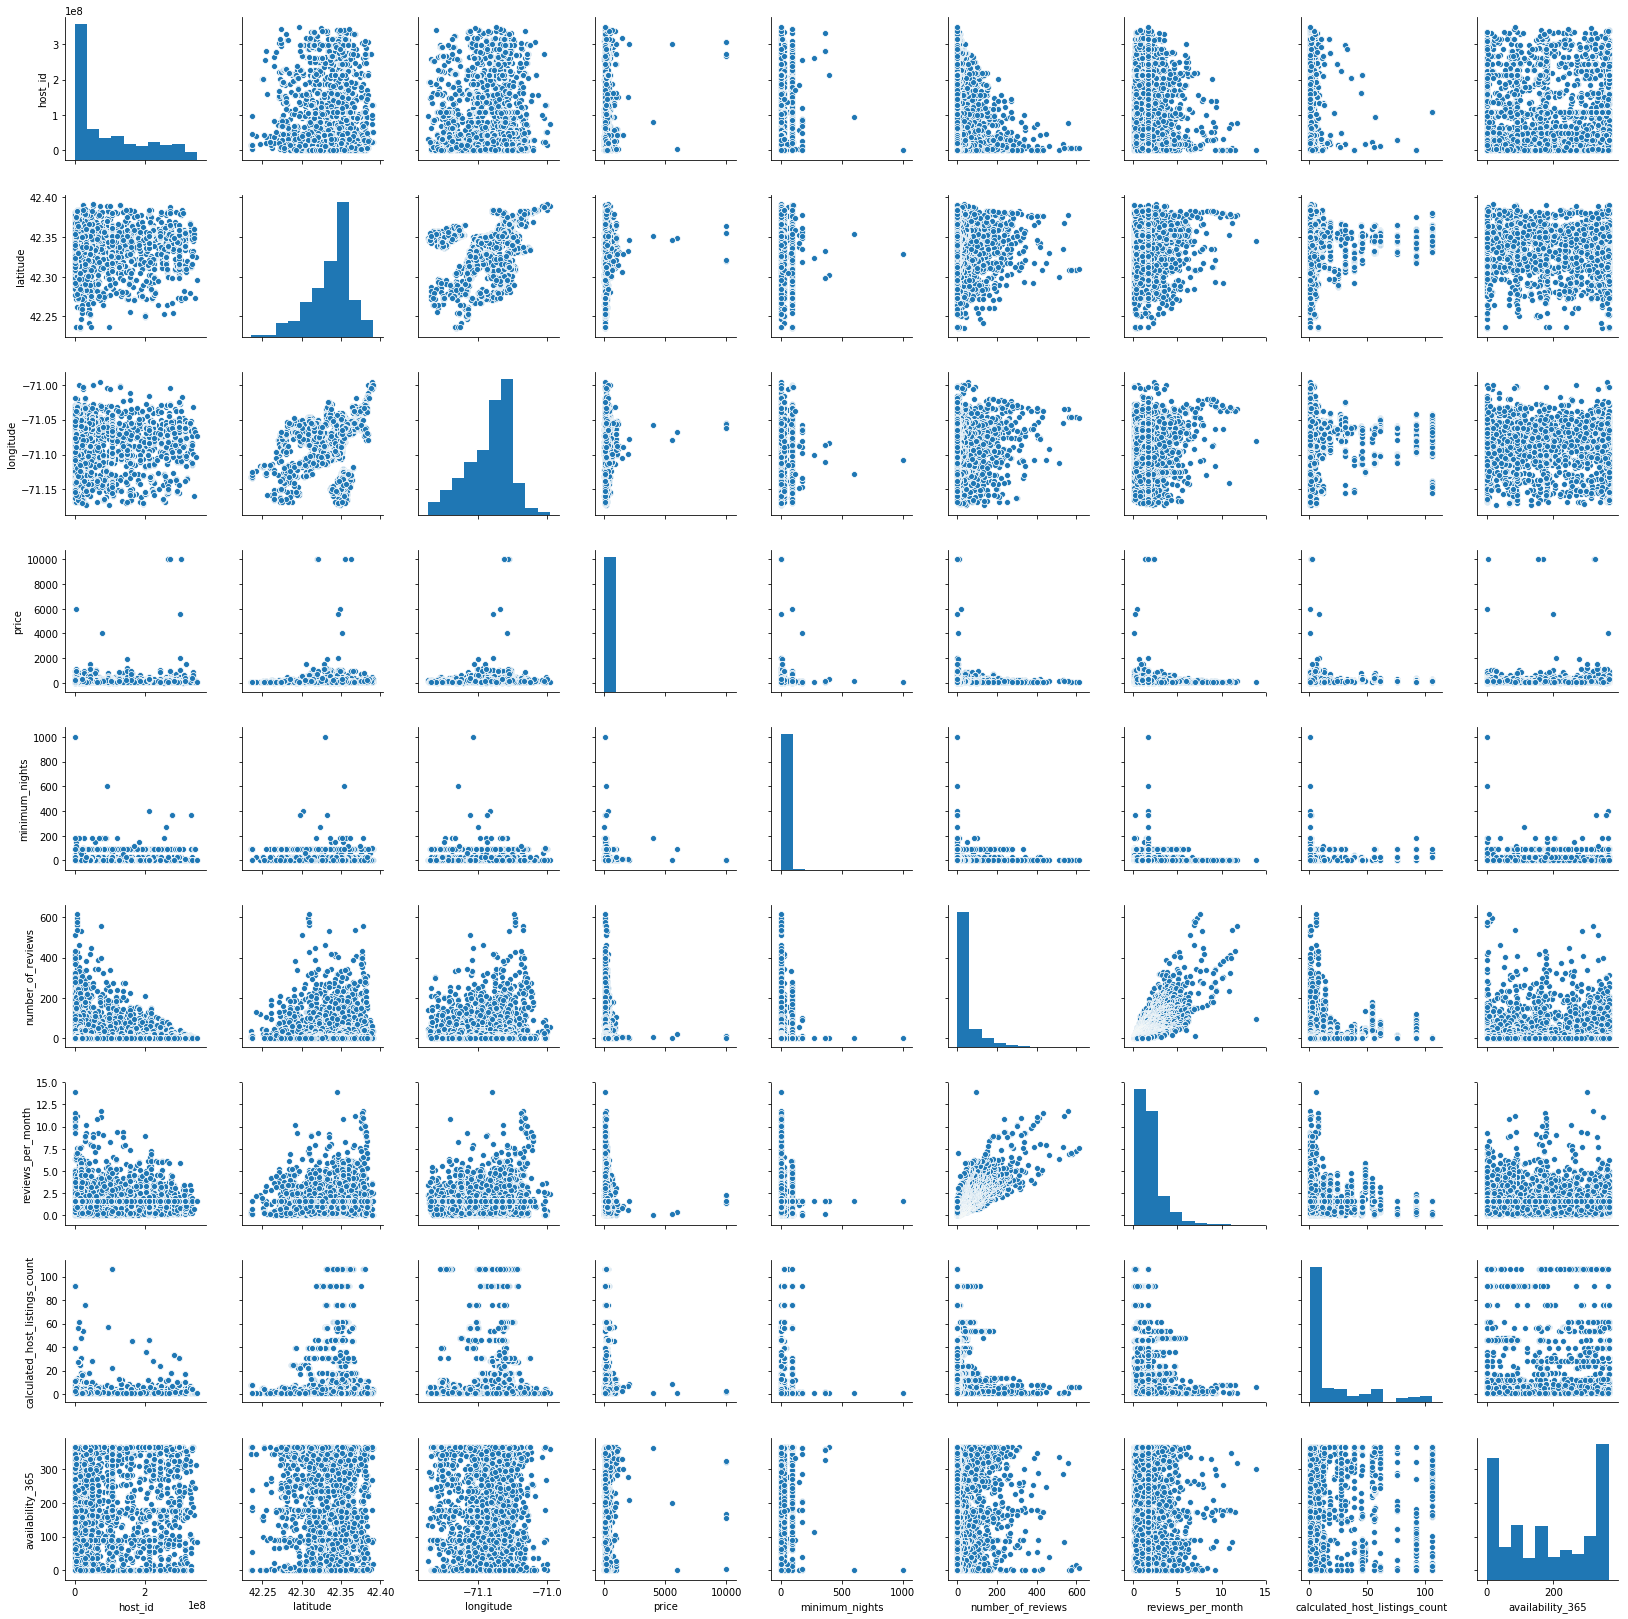
Figure 1.
Some insightful points (Check Figure 1.):
- Latitude: From South 42.25 to North 42.40, the number of listings for Boston Airbnb increases.
- Longitude: From West -71.15 to East -71.00, the number of listings for Boston Airbnb increases.
- The Number of Reviews and Reviews Per Month has a positive correlation.
#data-science #data-visualization #machine-learning #airbnb #predictive-analytics