At Syncfusion, we are continuously reviewing the constructive questions and comments we receive from our customers, which include various feature requests. From these, we handpicked the most widely requested features and made them available in the Essential Studio 2020 Volume 3 release.
In this blog post, I’ll quickly review the new chart types and features included in the Flutter Charts widget for the 2020 Volume 3 release.
Let’s see them!
New chart types
We extended the Syncfusion Flutter Charts widget to support two more chart types:
Box and whisker chart
The box and whisker chart is used to visualize a group of numerical data through its quartiles. It is also referred to as a box plot. Box plots may also have lines extending vertically from the boxes (whiskers) indicating variability outside the upper and lower quartiles.
Refer to the following code.
[Dart]
SfCartesianChart(
series: <BoxAndWhiskerSeries<ChartData, String>>[
BoxAndWhiskerSeries<ChartData, String>(
dataSource: <ChartData>[
ChartData(``'Development'``, [22, 22, 23, 25, 25, 25, 26, 27, 27]),
ChartData(``'HR'``, [22, 24, 25, 30, 32, 34, 36, 38, 39, 41]),
//...
],
showMean: **true**``,
xValueMapper: (ChartData data, _) => data.x,
yValueMapper: (ChartData data, _) => data.y
),
]
)
After executing this code example, we will get output like in the following screenshot.
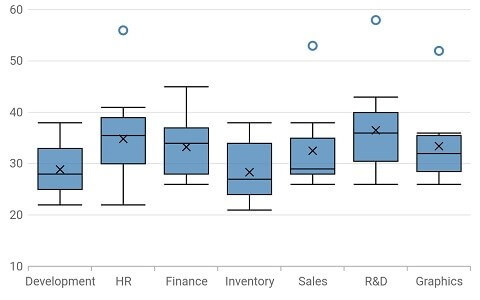 Box and whisker chart
UG link: https://help.syncfusion.com/flutter/cartesian-charts/chart-types#box-and-whisker-chart
SB sample link: https://flutter.syncfusion.com/#/cartesian-charts/chart-types/box-and-whisker/box-and-whisker-chart
Waterfall chart
The waterfall chart shows gradual changes in the quantitative value of an entity that is subjected to changes by increments or decrements. Using the waterfall chart, you can quickly illustrate changes in revenue.
Refer to the following code.
[Dart]
SfCartesianChart(
series: <ChartSeries<ChartData, double>>[
WaterfallSeries<ChartData, double>(
dataSource: <ChartData>[
ChartData(2, 10),
ChartData(3, -3),
ChartData(4, 5, **true**``),
//...
ChartData(13, -5, **false**``, **true**``),
],
xValueMapper: (ChartData data, _) => data.x,
yValueMapper: (ChartData data, _) => data.y,
intermediateSumPredicate: (ChartData data, _) => data.isIntermediate,
totalSumPredicate: (ChartData data, _) => data.isTotal,
negativePointsColor: const Color.fromRGBO(229, 101, 144, 1),
intermediateSumColor: const Color.fromRGBO(79, 129, 188, 1),
totalSumColor: const Color.fromRGBO(79, 129, 188, 1),
connectorLineSettings: WaterfallConnectorLineSettings(
width: 2.5,
dashArray: <double>[3, 1]
)
)
]
)
After executing this code example, we will get output like in the following screenshot.
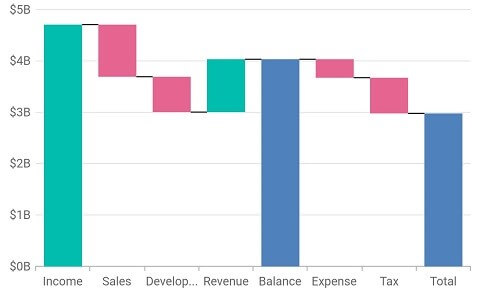 Waterfall chart
UG link: https://help.syncfusion.com/flutter/cartesian-charts/chart-types#waterfall-chart
SB sample link: https://flutter.syncfusion.com/#/cartesian-charts/chart-types/waterfall/default-waterfall-chart
#chart #flutter #mobile #what's new #android #charts #ios
