At the end of last article “An Easy Way to Draw Spider Charts on Tableau — Part I”, we left a question: how to provide a “web” background for our “spiders”.
There are many tutorial articles and videos to teach people how to draw a radar background using calculations on Tableau, but I found them a little bit so complicated and hard to understand. I developed this easy way to get a background “web” from Excel and imported the “web” as a picture into Tableau. It’s very easy and straightforward to follow, so why not try to start “weaving your own web” from now?
In this article, I will still use the same university ranking example in Part I to help you understand the steps better.
>>> Step 1: Draw a “web” at Excel
Since we have 6 categories of [Qualities], we should weave a web consisting of 6 corners at Excel as well.
Open an Excel > Copy the 6 qualities and their scores and paste them at Excel > “Insert” > “Charts” > “Radar”
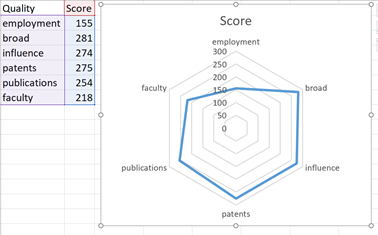
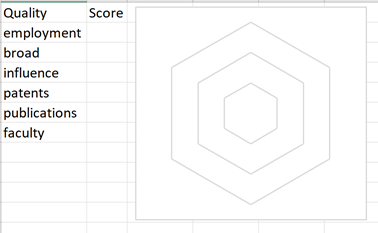
Delete all the titles, axes and labels on the chart > Delete all the score numbers
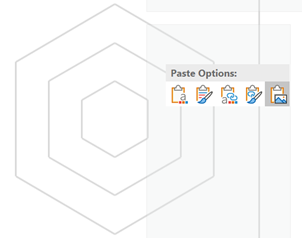
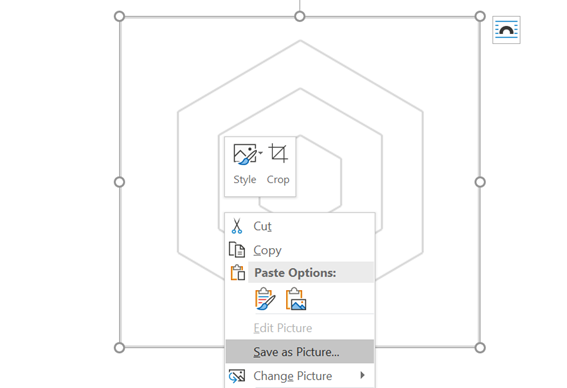
Copy the chart at Excel and paste it as a picture at Microsoft Word > Save the web picture to your local device
>>> Step 2: Import the “web” into Tableau
In the radar chart sheet, click “Map” > “Background Images” > “Add Image…”
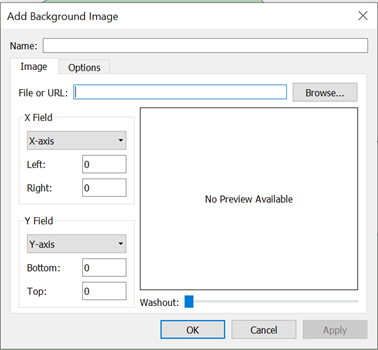
Find your web picture in “Browse” > Select a proper level of “Washout”
#data-visualization #excel #data-science #tableau #data analysis
