How to create Google Map in Python using Gmaps
Python Google Map Introduction With Gmaps – In this article we are going to talk about creating Google Map in Python using Gmaps.
gmaps is a Jupyter plugin for embedding Google maps in Jupyter notebooks. It is designed to help visualize and interact with geographical data.
Also you can check the documentation of gmaps – Read Docs
Installation Process
1: The easiest way to install gmaps is with conda:
$ conda install -c conda-forge gmaps2: Installing jupyter-gmaps with pip
Make sure that you have enabled ipywidgets widgets extensions:
$ jupyter nbextension enable –py –sys-prefix widgetsnbextensionYou can then install gmaps with:
$ pip install gmapsThen tell Jupyter to load the extension with:
$ jupyter nbextension enable –py –sys-prefix gmapsAuthentication
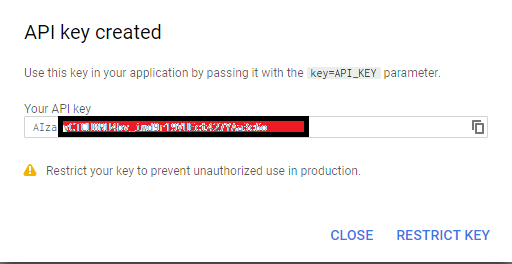
Most operations on Google Maps require that you tell Google who you are. To authenticate with Google Maps, you need to go Google Cloud Console
and create a new project and after that create your API Key from credentials. The API key is a string that starts with the letters AI.
Also after creation of API Key, you need to enable Maps Javascript API.
So now lets get started
gmaps is a plugin for Jupyter for embedding Google Maps in your notebooks. It is designed as a data visualization tool. To demonstrate gmaps, let’s plot the earthquake dataset, included in the package:
Run your jupyter notebook and add this code
import gmaps
import gmaps.datasets
gmaps.configure(api_key='AI...')
earthquake_df = gmaps.datasets.load_dataset_as_df('earthquakes')
earthquake_df.head()
After run you will see this result
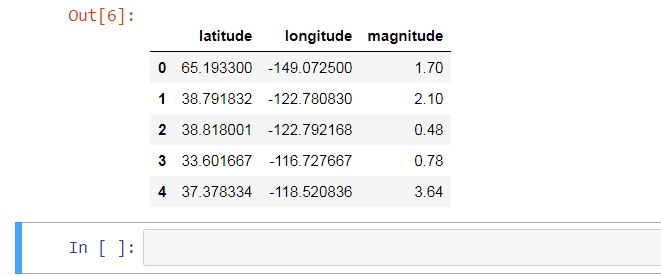
The earthquake data has three columns: a latitude and longitude indicating the earthquake’s epicentre and a weight denoting the magnitude of the earthquake at that point. Let’s plot the earthquakes on a Google map:
locations = earthquake_df[['latitude', 'longitude']]
weights = earthquake_df['magnitude']
fig = gmaps.figure()
fig.add_layer(gmaps.heatmap_layer(locations, weights=weights))
fig
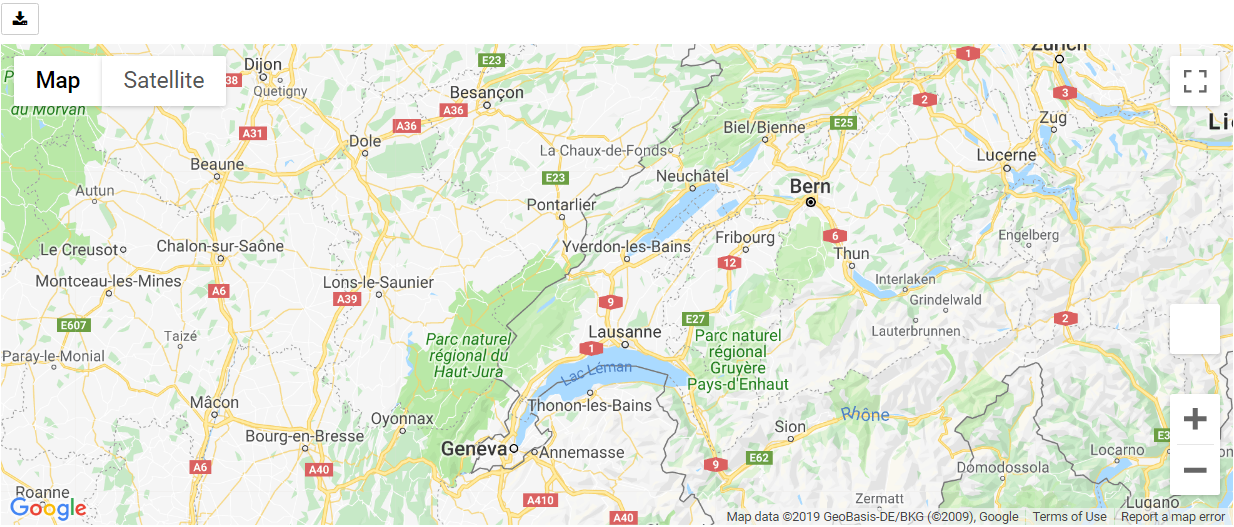
This will be the result

This gives you a fully-fledged Google map. You can zoom in and out, switch to satellite view and even to street view if you really want. The heatmap adjusts as you zoom in and out.
gmaps is built around the idea of adding layers to a base map. After you’ve authenticated with Google maps, you start by creating a figure, which contains a base map:
import gmaps
gmaps.configure(api_key='AI...')
fig = gmaps.figure()
fig
Run this code this will be the result
You then add layers on top of the base map. For instance, to add a heatmap layer:
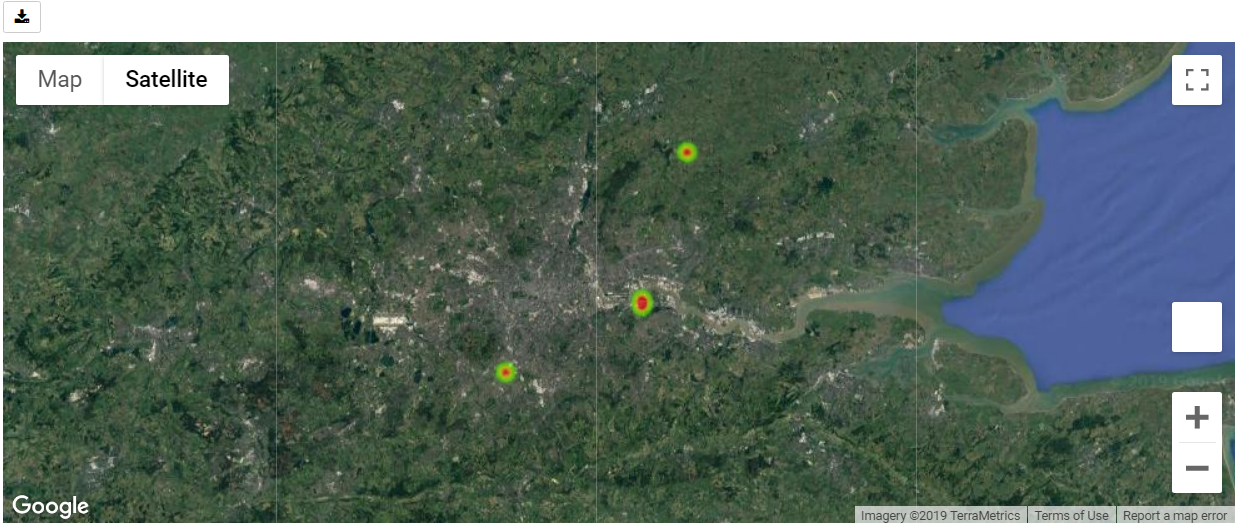
import gmaps
import gmaps.datasets

gmaps.configure(api_key='AIz')
fig = gmaps.figure(map_type='SATELLITE')
# generate some (latitude, longitude) pairs
locations = [(51.5, 0.1), (51.7, 0.2), (51.4, -0.2), (51.49, 0.1)]
heatmap_layer = gmaps.heatmap_layer(locations)
fig.add_layer(heatmap_layer)
fig
And this will be the result
The locations array can either be a list of tuples, as in the example above, a numpy array of shape $N times 2$ or a dataframe with two columns.Most attributes on the base map and the layers can be set through named arguments in the constructor or as instance attributes once the instance is created.
Base Maps
Your first action with gmaps will usually be to build a base map:
import gmaps

gmaps.configure(api_key='AIz')
gmaps.figure(center=new_york_coordinates, zoom_level=12)
Run the code this will be the result
If you do not set the map zoom and center, the viewport will automatically focus on the data as you add it to the map. Google maps offers three different base map types. Choose the base map type by setting the map_type parameter:
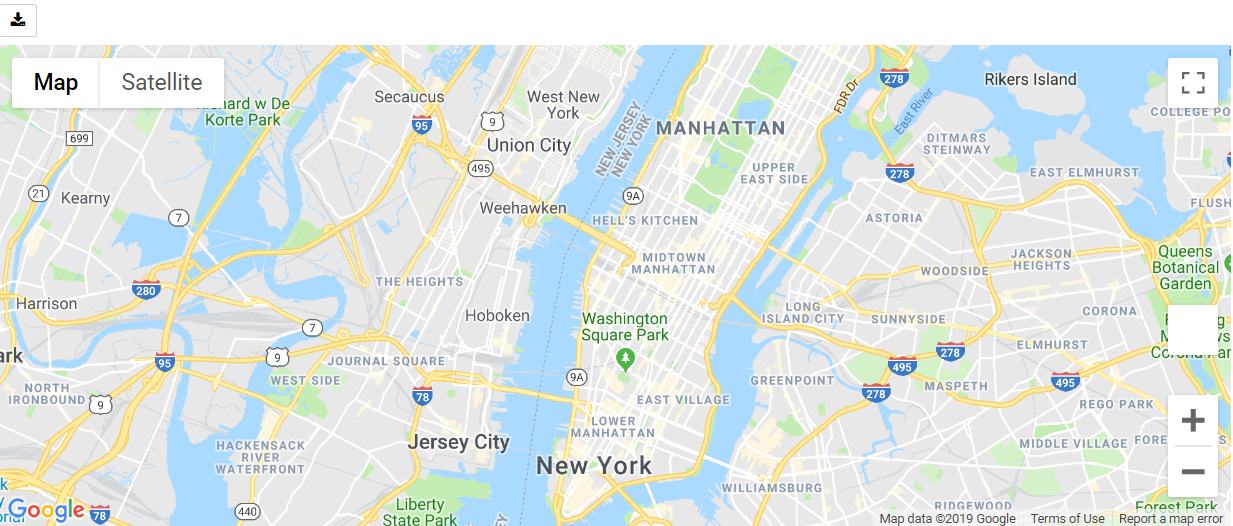
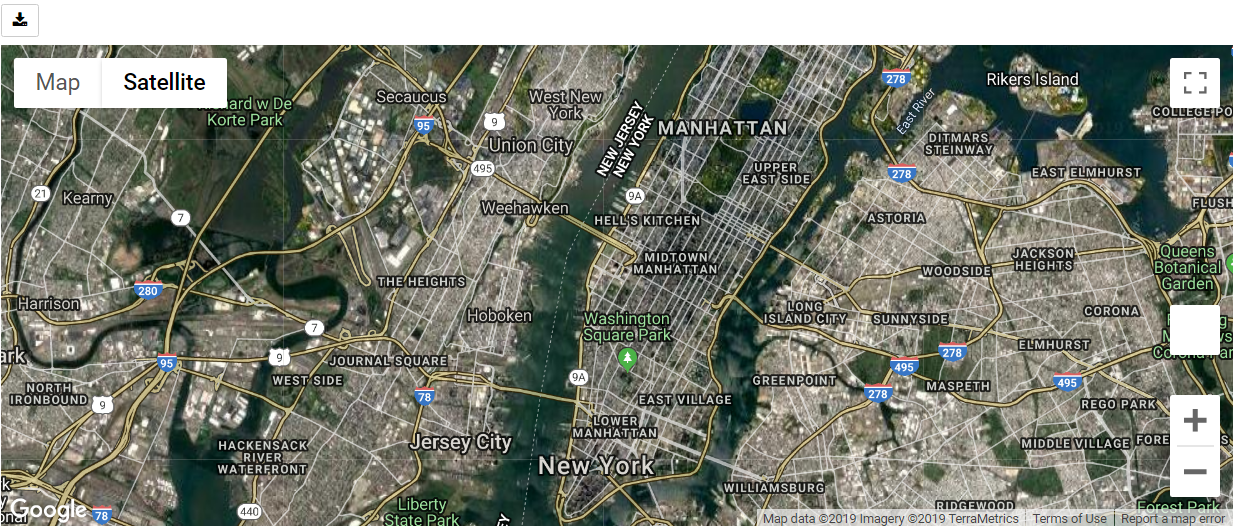
import gmaps

gmaps.configure(api_key='AIz')
new_york_coordinates = (40.75, -74.00)
gmaps.figure(center=new_york_coordinates, zoom_level=12, map_type='HYBRID')
Run the code this will be the result
Also this is another map type
import gmaps

gmaps.configure(api_key='AIz')
new_york_coordinates = (40.75, -74.00)
gmaps.figure(center=new_york_coordinates, zoom_level=12, map_type='TERRAIN')
So this will be the result
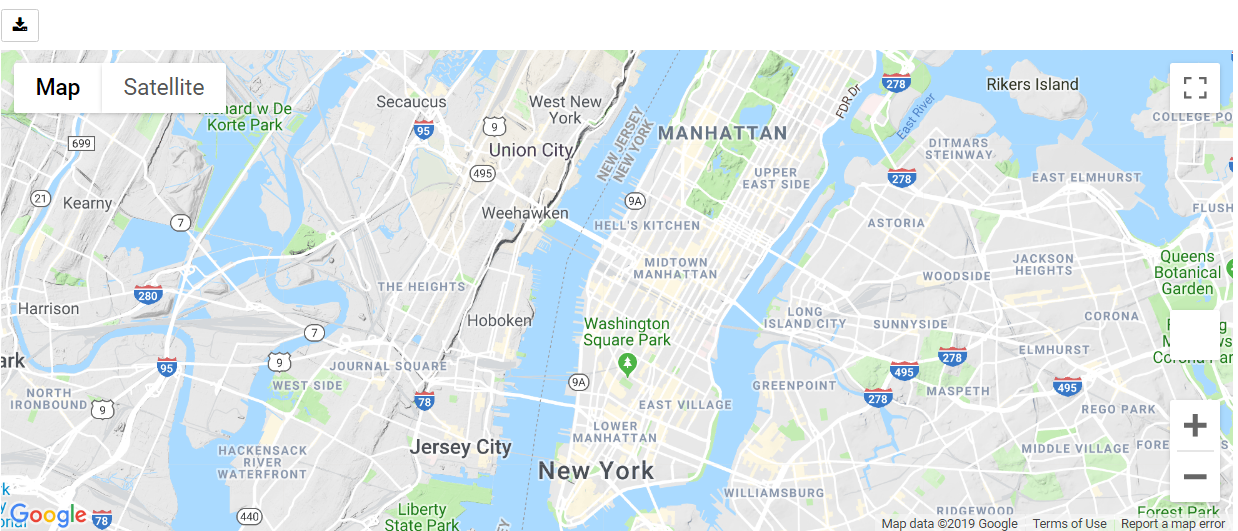
There are four map types available:
- ‘ROADMAP’ is the default Google Maps style,
- ‘SATELLITE’ is a simple satellite view,
- ‘HYBRID’ is a satellite view with common features, such as roads and cities, overlaid,
- ‘TERRAIN’ is a map that emphasizes terrain features.
Also you can watch the complete video for this article
#python #web-development