As data becoming more and more prevalent, making them come to life with visualizations also becomes more common. It helps us understand trends and patterns that otherwise would be hard to spot.
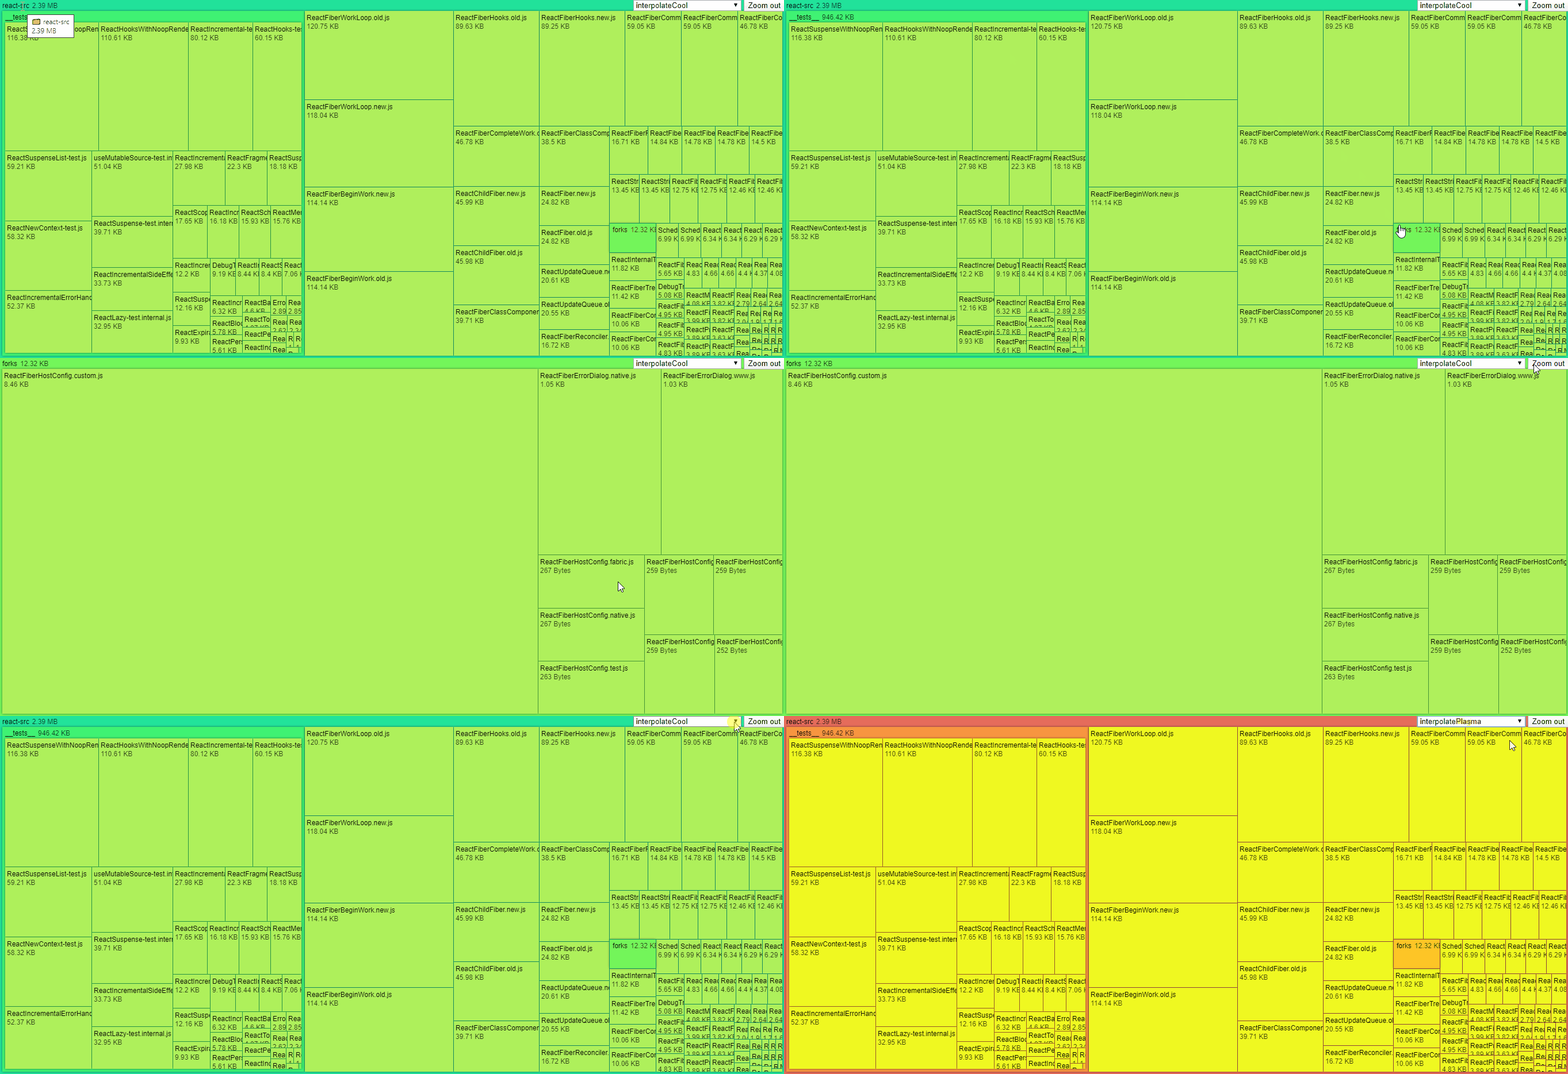
In this tutorial, we will be looking at how to make a treemap. Inspired by Mike Bostock’s — the creator of D3.js — solution on Observable, we will go through how this can be done in the latest, sixth version of D3.js. This is what we will create:

#javascript #web-development #frontend #data-visualization #webtips

2.25 GEEK
