24 JavaScript Libraries for Creating Beautiful Charts
It’s practically impossible to imagine any dashboard without graphs and charts. They present complex statistics quickly and effectively. Additionally, a good graph also enhances the overall design of your website.
While most of the libraries are free and open source, some of them provide a paid version with additional features.
D3.js — Data-Driven Documents
When we think of charting today, D3.js is the first name that comes up. Being an open source project, D3.js definitely brings many powerful features that were missing in most of the existing libraries. Features like “Enter and Exit”, powerful transitions and syntax familiarity with jQuery or Prototype make it one the best JavaScript libraries for charting. Charts in D3.js are rendered via HTML, SVG and CSS.
Unlike many other JavaScript libraries, D3.js doesn’t ship with any pre-built charts out of the box. However, you can look at the list of graphs built with D3.js to get an overview.
D3.js doesn’t work well with older browsers like IE8. You can always use plugins like aight plugin for cross browser compatibility.
Websites like NYTimes, Uber and Weather.com have used D3.js extensively in the past.
Google Charts
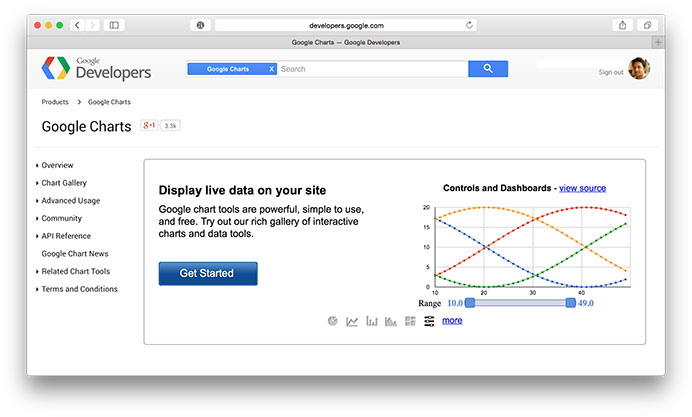
Google Charts is my go-to JavaScript library for creating charts easily. It provides many pre-built charts like area charts, bar charts, calendar charts, pie Charts, geo charts, and more.
Google charts also comes with various customization options that help in changing the look of the graph. Charts are rendered using HTML5/SVG to provide cross-browser compatibility and cross platform portability to iPhones, iPads, and Android. It also includes VML for supporting older IE versions.
Here’s a great list of examples built using Google charts.
ChartJS
ChartJS provides beautiful flat designs for charts. It uses HTML5 canvas element for rendering. Support for older browsers like IE7/8 is added through polyfill.
ChartJS charts are responsive by default. They work well in mobiles and tablets. With 6 different types of core charts out of the box (core, bar, doughnut, radar, line, and polar area), ChartJS is definitely one of the most impressive open source charting libraries in recent times.
Chartist.js
Chartist.js provides beautiful responsive charts. Just like ChartJS, Chartist.js is also the product of the community that was frustrated by using highly priced JavaScript charting libraries. It uses SVG to render the charts. It can be controlled and customised through CSS3 media queries and Sass. Also, note that Chartist.js provides cool animations that will work only in modern browsers.
n3-charts
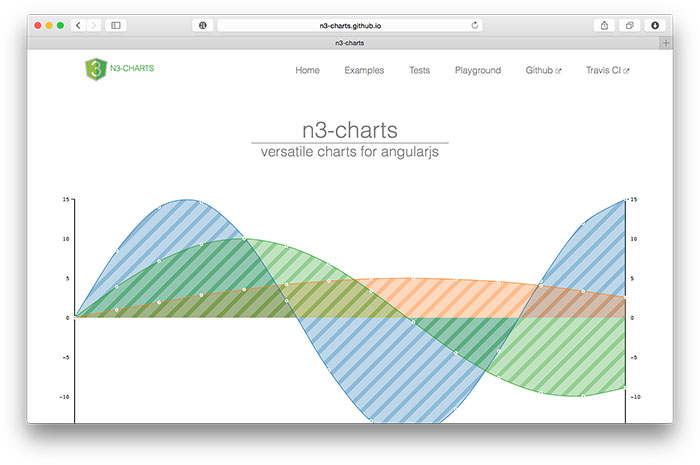
If you are an Angular developer, you will definitely find n3-charts extremely useful and interesting. n3-charts is built on top of D3.js and Angular. It provides various standard charts in the form of customisable Angular directives.
Checkout list of charts built using ns-charts.
Ember Charts
Ember Charts is another great open source repository built with D3.js and Ember.js. It provides time series, bar, pie, and scatter charts that are easily customisable. It uses SVG to render charts.
Smoothie Charts

If you are dealing with stream realtime data, Smoothie Charts may be helpful. It uses HTML5 canvas element to render the chart. It is a pure JavaScript library that provides options like delay and splash colors to the realtime graphs.
Chartkick
Chartkick is a JavaScript charting library built for Ruby applications. It provides all the major chart types like pie, column, bar, area, geo, timeline, and multiple series. The charts render via SVG.
ZingChart
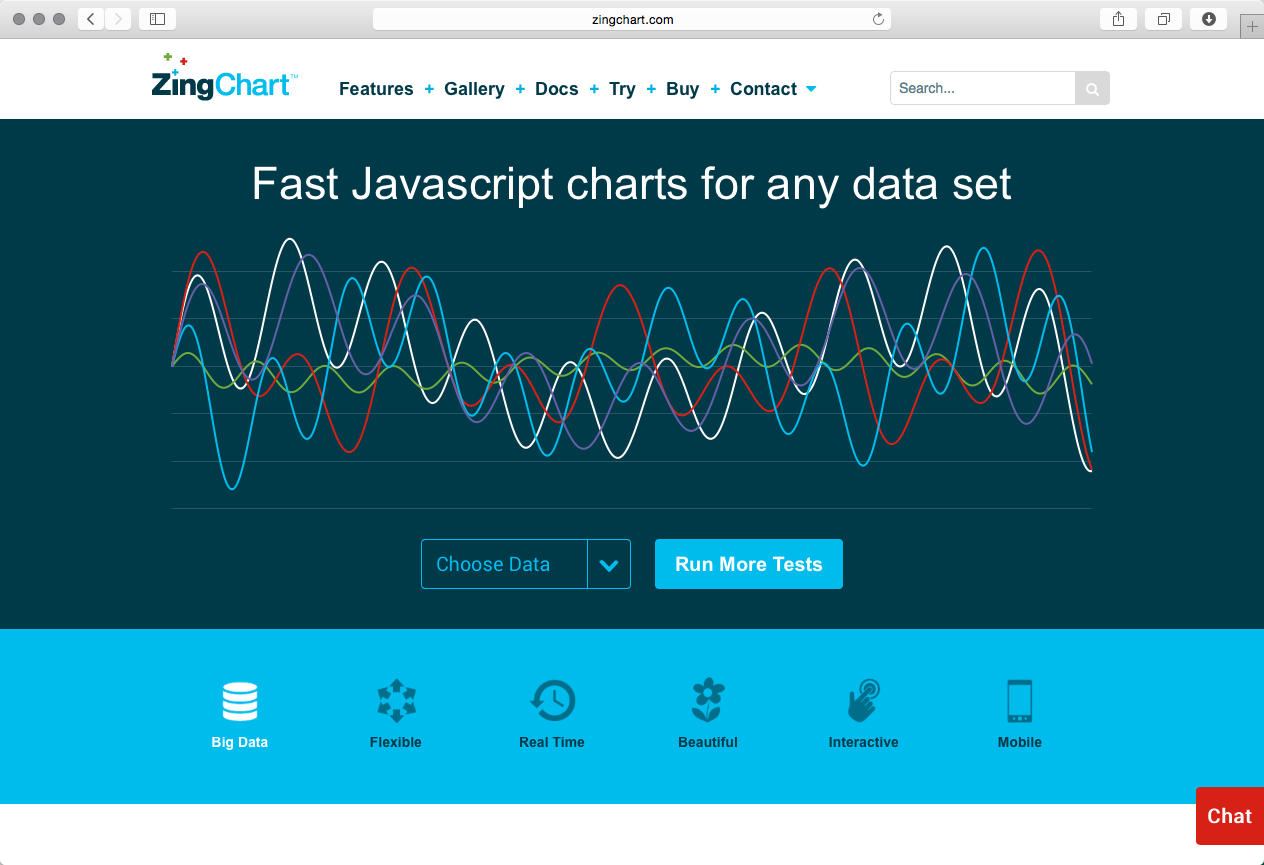
ZingChart offers a flexible, interactive, fast, scalable and modern product for creating charts quickly. Their product is used by companies like Apple, Microsoft, Adobe, Boeing and Walmart, and uses Ajax, JSON, HTML5 to deliver great-looking charts quickly.
Free to try, ZingChart licenses can also be bought at a variety of price-points to suit your business size.
Highcharts JS
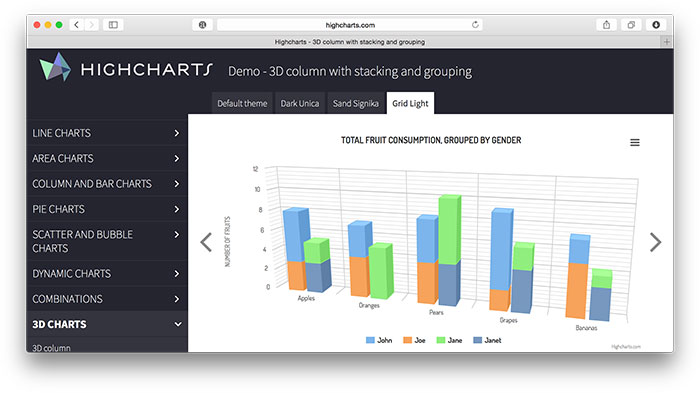
Highcharts JS is another very popular library for building graphs. It comes loaded with many different types of cool animations that are sufficient to attract many eyeballs to your website. Just like other libraries, Highcharts comes with many pre-built graphs like spline, area, areaspline, column, bar, pie, scatter, etc.
One of the biggest advantages of using Highcharts JS is the compatibility with older browsers — even way back to Internet Explorer 6. Standard browsers use SVG for the graphics rendering. In legacy Internet Explorer, graphics are drawn using VML.
While Highcharts JS is free for personal use, you need to purchase a license for commercial usage.
Fusioncharts
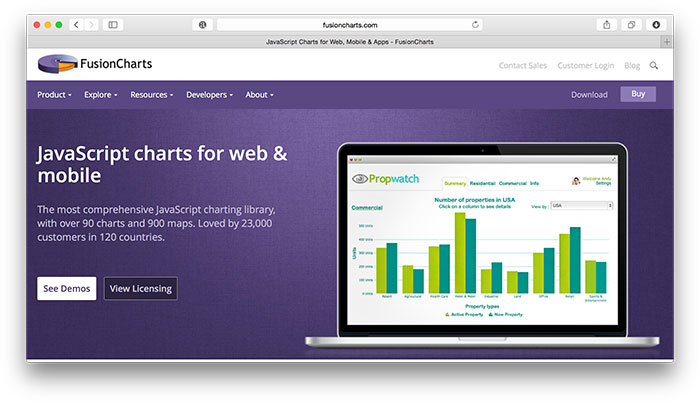
Fusioncharts is one of the oldest JavaScript charting libraries, released way back in 2002. Charts are rendered using HTML5/SVG and VML for better portability and compatibility.
Unlike many libraries, Fusioncharts provides data parsing through both JSON and XML. You can also export these charts in three different formats — PNG, JPG and PDF.
Fusioncharts is highly compatible with older browsers — even way back to Internet Explorer 6. This backwards compatibility made it a very popular choice for a long time.
You can use the watermarked version of Fusioncharts for free in both personal and commercial projects. However, you need to purchase a license to remove the watermark.
Flot
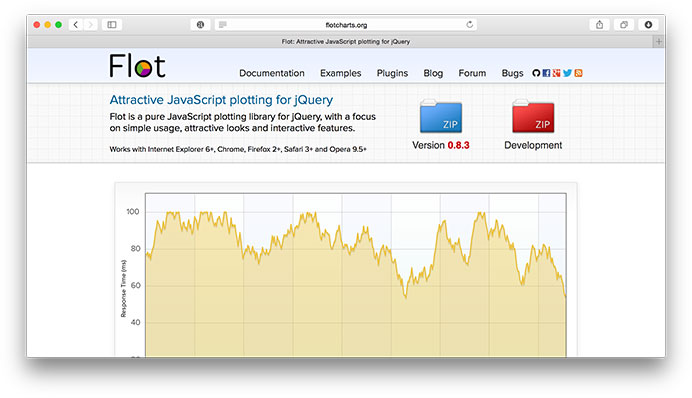
Flot is a JavaScript charting library for jQuery. It is also one of the oldest and popular charting libraries.
Flot supports lines, points, filled areas, bars and any combinations of these. It’s also compatible with older browsers — way back to IE6 and Firefox 2.
Flot is completely free to use and commercial support is provided on special request to the creator. It’s maybe getting a bit old now (the last commit was in 2014) but it’s still worth checking out. Here’s a list of example graphs created using Flot.
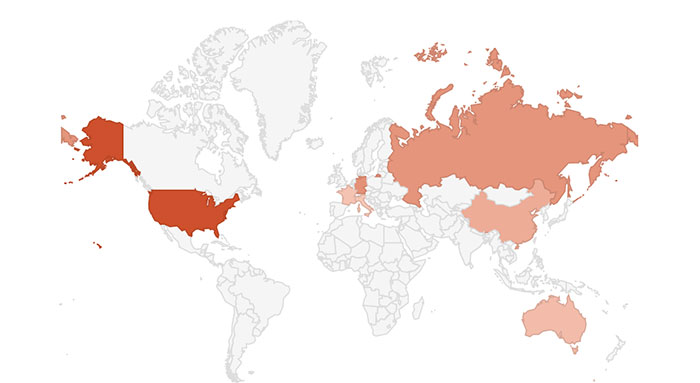
amCharts
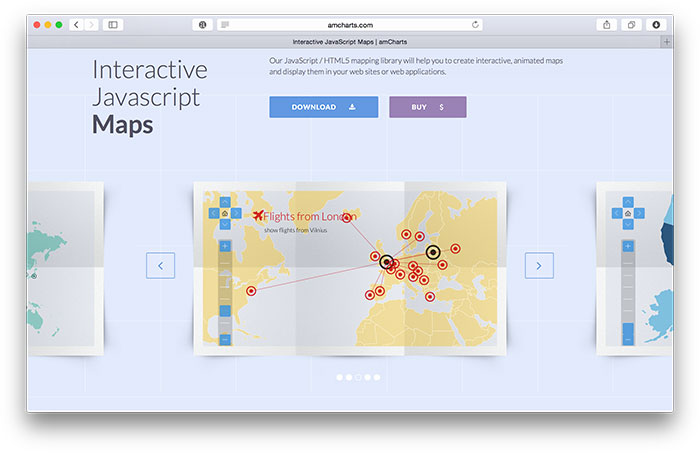
amCharts is undoubtedly one of the most beautiful charting libraries out there. It perfectly segregates itself into 3 independent charts — JavaScript Charts, Maps Charts (amMaps), and Stock charts.
amMaps is my favorite out the above three. It provides features like loading icons or photos on top of your map, heatmaps, drawing lines, and adding text on maps, zooming and others.
amCharts uses SVG to render charts that work in modern browsers.
Checkout this fantastic collection of cool demos created using amCharts.
The free version of amChart will leave a backlink to its website on the top of every chart. The commercial licenses are bit more expensive than most of the paid libraries in the market.
EJSCharts
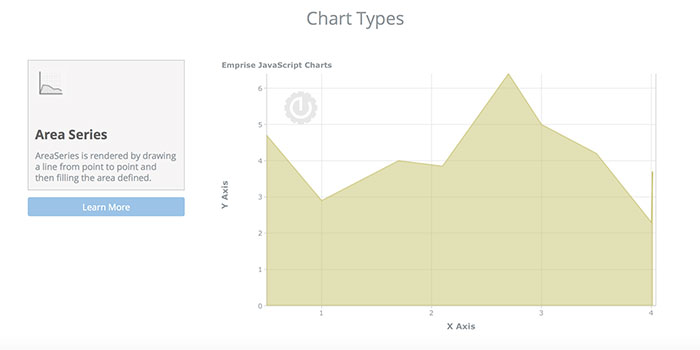
EJSCharts is the open source solution for home and business data representation and customization. The makers describe it as an enterprise ready charting library. The charts look clean and readable than most of the older charting libraries. Check out this list of examples.
EJSCharts comes in free and paid versions. The free version limits you to use maximum of 1 chart per page and 2 series per chart. Have a look at the pricing details here.
uvCharts
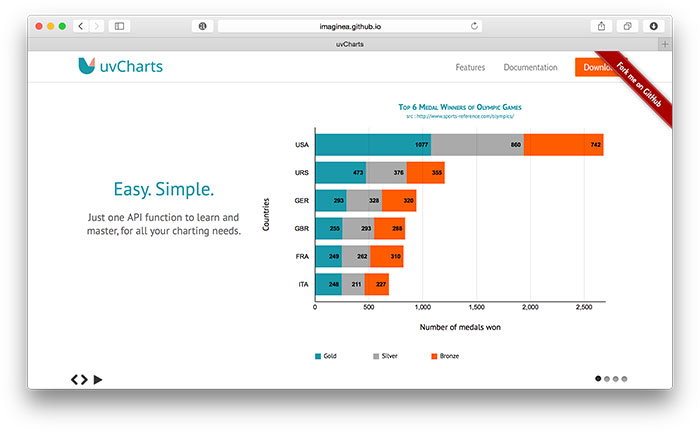
uvCharts is an open source JavaScript charting library that claims to have 100+ customization options. It has 12 different standard chart types out of the box.
uvCharts is built using D3.js library. It promises to eliminate all the difficult coding parts from D3.js and provide easy implementations of standard chart types. uvCharts are rendered using SVG, HTML and CSS.
Plotly.js
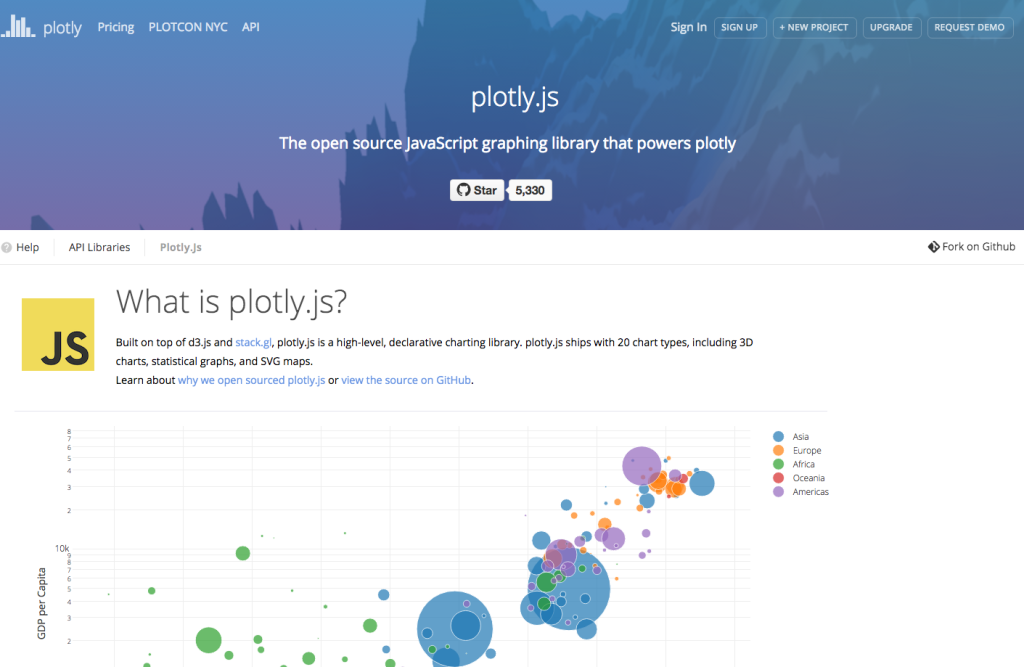
Plotly.js is the first scientific JavaScript charting library for the web. It has been open-source since 2015, meaning anyone can use it for free. Plotly.js supports 20 chart types, including histograms, 3d plots, error bars, and maps. It can also do all of the basic charts like bar charts, line charts, and pies.
Plotly.js uses D3.js under-the-hood, so its an easier way to make D3.js graphs than using D3.js by itself. For some examples of graphs made with Plotly.js, check out Plotly’s graph news feed.
Conclusion
It now depends on you to select the best charting library for your future projects. Developers who like to have all the controls over their charts will definitely opt for D3.js. Almost all the above libraries have got a good support via Stack Overflow forums.
If you are looking for tools to generate ready made charts, head over to 5 Tools for Creating Amazing Online Charts article. You can also read Creating Simple Line and Bar Charts Using D3.js article to get started with D3.js. We also have a dedicated series on using Google Charts with Angular.
There are lots of other charting and graphing libraries out there. Here are some more worth checking out:
- GoJS is a JavaScript diagramming library for interactive flowcharts, org charts, design tools, planning tools, visual languages.
- C3.js is a D3-based reusable chart library.
- dimple is an object-oriented API for business analytics powered by d3.
- Charted, by Medium, is a tool that automatically visualizes data. You just give it a link to a data file. (You can read more about it at Medium.)
Lastly, here are some simpler tools for quickly creating infographics:
- GoJS is a JavaScript diagramming library for interactive flowcharts, org charts, design tools, planning tools, visual languages.
- C3.js is a D3-based reusable chart library.
- dimple is an object-oriented API for business analytics powered by d3.
- Charted, by Medium, is a tool that automatically visualizes data. You just give it a link to a data file. (You can read more about it at Medium.)
Originally published by Syed Fazle Rahman at https://www.sitepoint.com
#javascript #web-development #programming #developer
