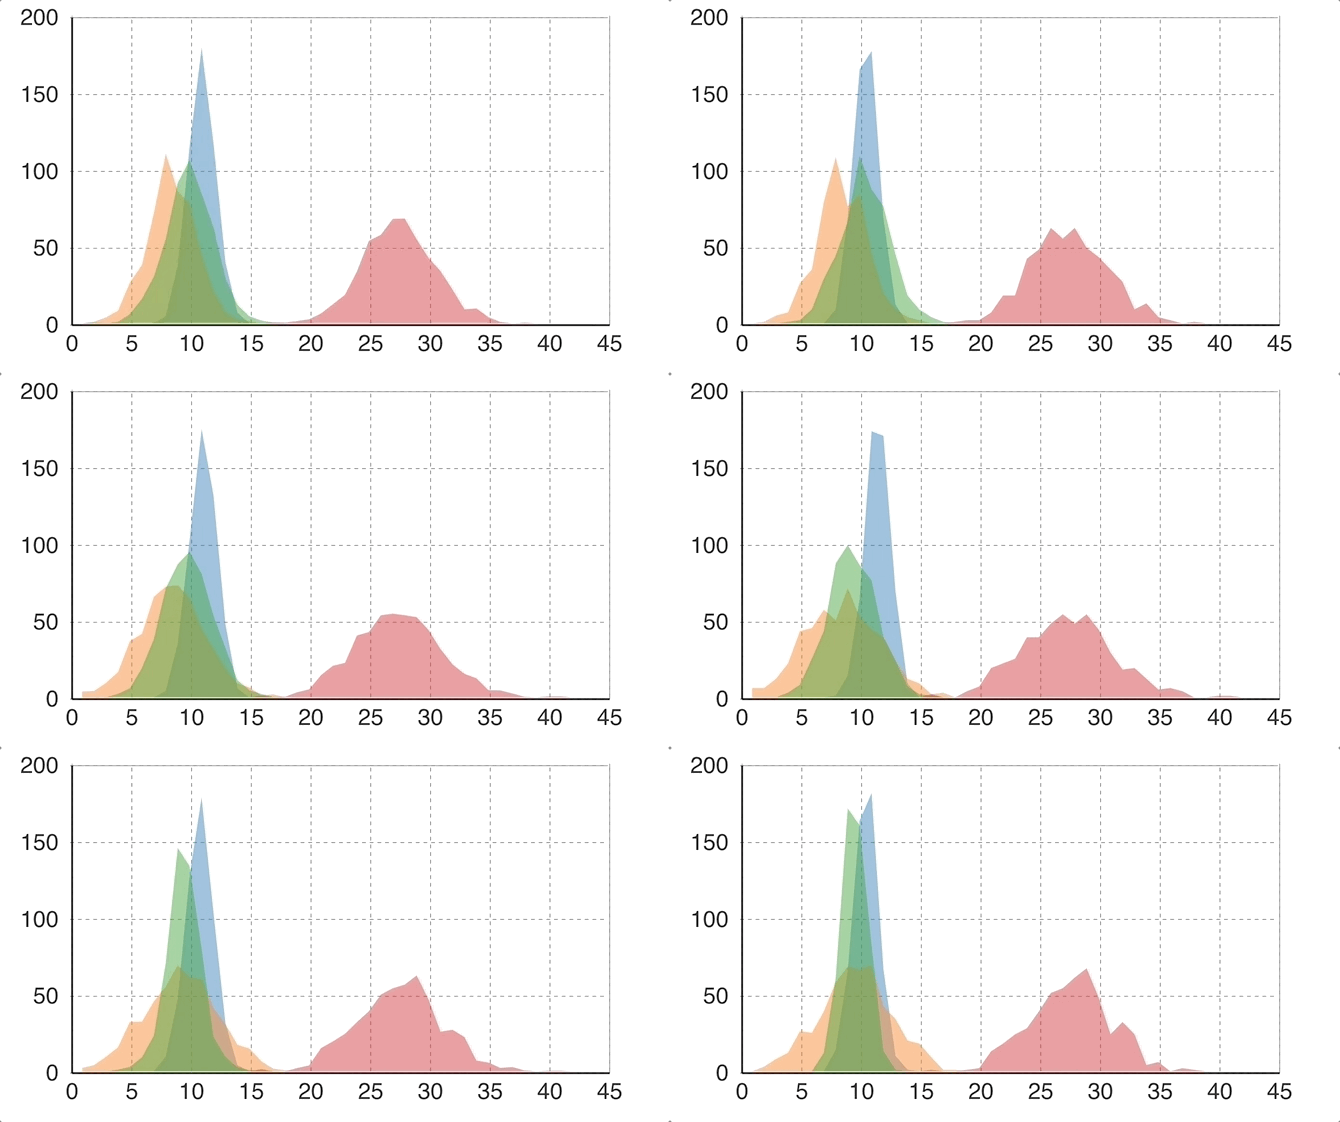
Real-time pizza delivery lead-time frequency distribution (fictional data)
This article shows you how to build reactive charts inside an Angular 8 application using the D3 JavaScript framework.
While there are a number of good articles and discussion threads covering this topic (some listed in the references), I have attempted to bring together all the key aspects necessary for creating production-ready code.
- GitHub repo
- Live demo
Why D3 on Top of Angular?
D3’s (Data-Driven-Documents) core capability is to manipulate DOM elements in response to dynamic application data. But, so it is for Angular, React, jQuery, and a host of other frameworks.
The motivation to use the D3 (or similar) framework with Angular is to provide the following data visualization capabilities:
- Dynamically creating and removing graphical elements from the DOM.
- Binding application data to graphical elements.
- Transforming user data to chart and shape coordinates.
- Animating graphical elements using transitions and interpolation.
- Advanced mathematical functions.
Given these D3 capabilities and lack of equivalent features in Angular, we proceed with mixing the two with an abundance of caution.
#data-visualization #d3js #charts #angular #angular 8
