Ever since I got my first internship at a Data Science startup, The learning curve has been immense and the set of problems I have faced, diverse. From preprocessing Retail data to understanding forecasting, It has been quite the journey and is just getting started.
Recently, I have had the chance to work on “Time Series” which to put it in easier terms, is a type of analysis that captures trends and studies the behavior of data over some time and I would like to share some important concepts and terminologies learned. For this article, I will be using a dummy Sale information dataset over the course of two years. Let’s get started
Rolling Average
When we have a trend that looks like this:
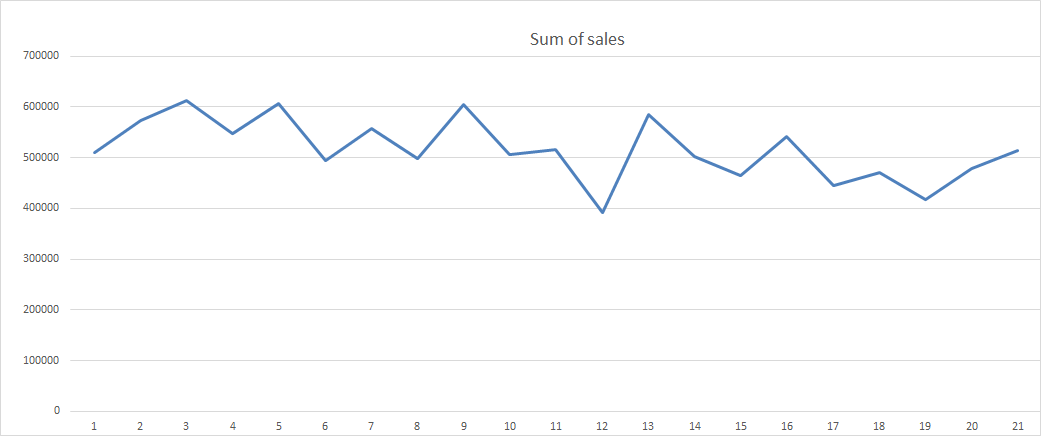
Sales information over a period of 21 months
It is very easy to note that the sum of Sales has an unsteady and variable behavior over these two years with highs and lows scattered across the graph.
This type of behavior has to be “smoothed” out if any sort of prediction has to be made and that’s where the rolling average comes in.
What the rolling average does is that it takes an average of the first 2 numbers and **uses that to find the average of the next number. **Let me explain this with an example. The column below is the aggregated Sales information for the company for over 21 months in order.
#technology #time #machine-learning #data-science #forecasting