Vue Datamaps - Vue port of the javascript-based DataMaps
It is a Vue port of the javascript-based DataMaps
Live Demo
Run Demo
# project clone
$ git clone https://github.com/Seungwoo321/vue-datamaps.git

# move to example directory
$ cd vue-datamaps/example/

# install dependencies
$ npm install

# run
$ npm run serve
Installation
# install
$ npm install vue-datamaps
Base Usage
Required
- If
dataUrlis specified ingeographyConfig, the library will make a fetch API call to retrieve the data. Otherwise, the JSON data located in the data folder in the root of the project can be used.
Global
main.js
import Vue from 'vue'
import VueDatamaps from 'vue-datamaps'

Vue.use(VueDatamaps)
vue template
<template>
    <div id="app">
        <vue-datamaps></vue-datamaps>
    </div>
</template>
Component Style
vue template
<template>
    <div id="app">
        <vue-datamaps></vue-datamaps>
    </div>
</template>
<script>
import { VueDatamaps } from 'vue-datamaps'
export default {
    components: {
        VueDatamaps
    }
}
</script>
Example
<template>
<div>
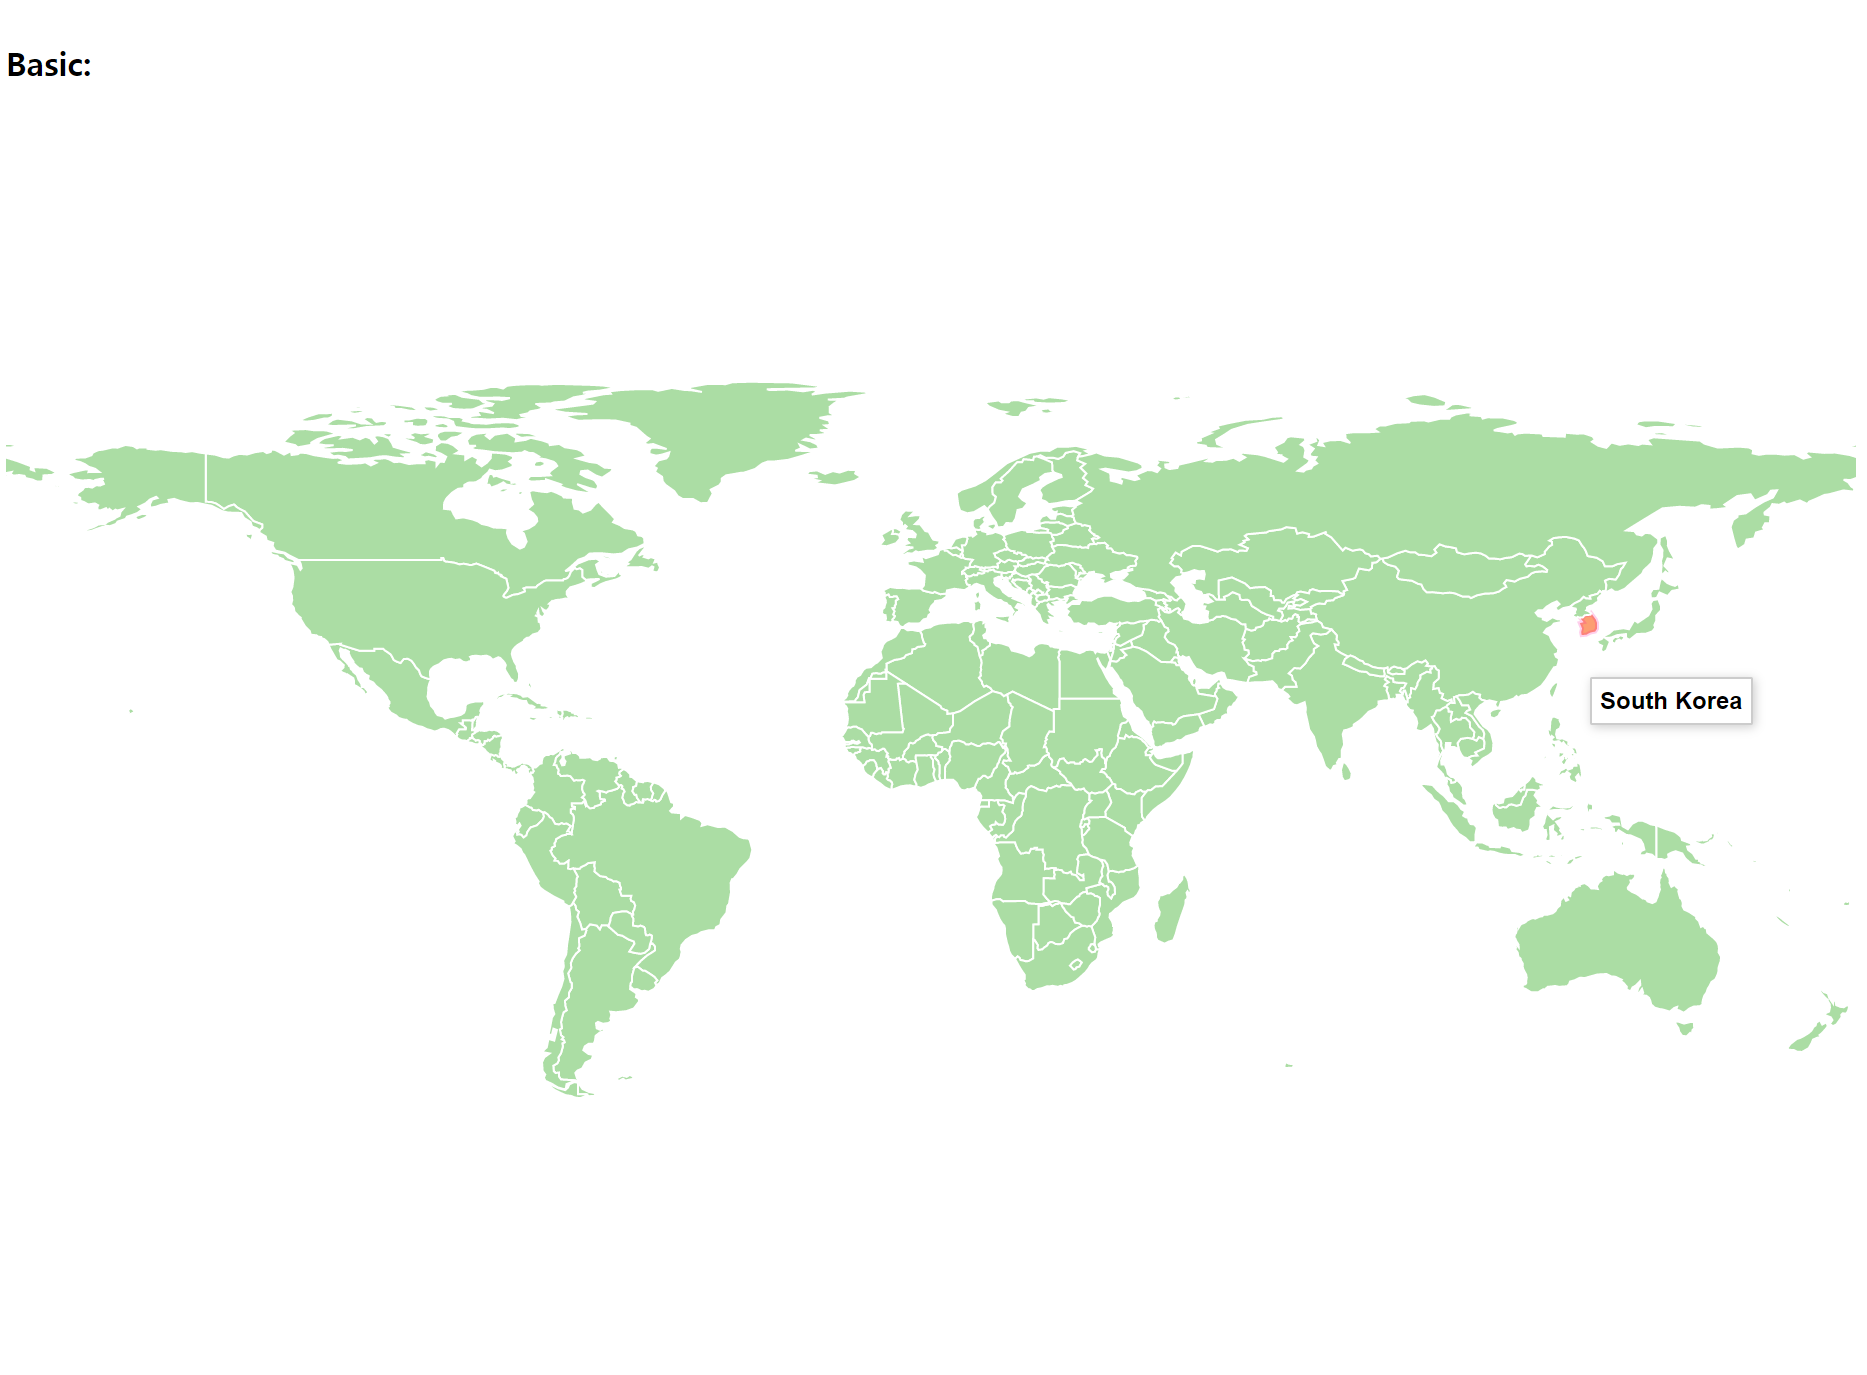
<h4>Basic:</h4>
<vue-datamaps/>
</div>
</template>
<script>
import { VueDatamaps } from 'vue-datamaps'
export default {
components: {
VueDatamaps
}
}
</script>
<style>
</style>
<template>
<div>
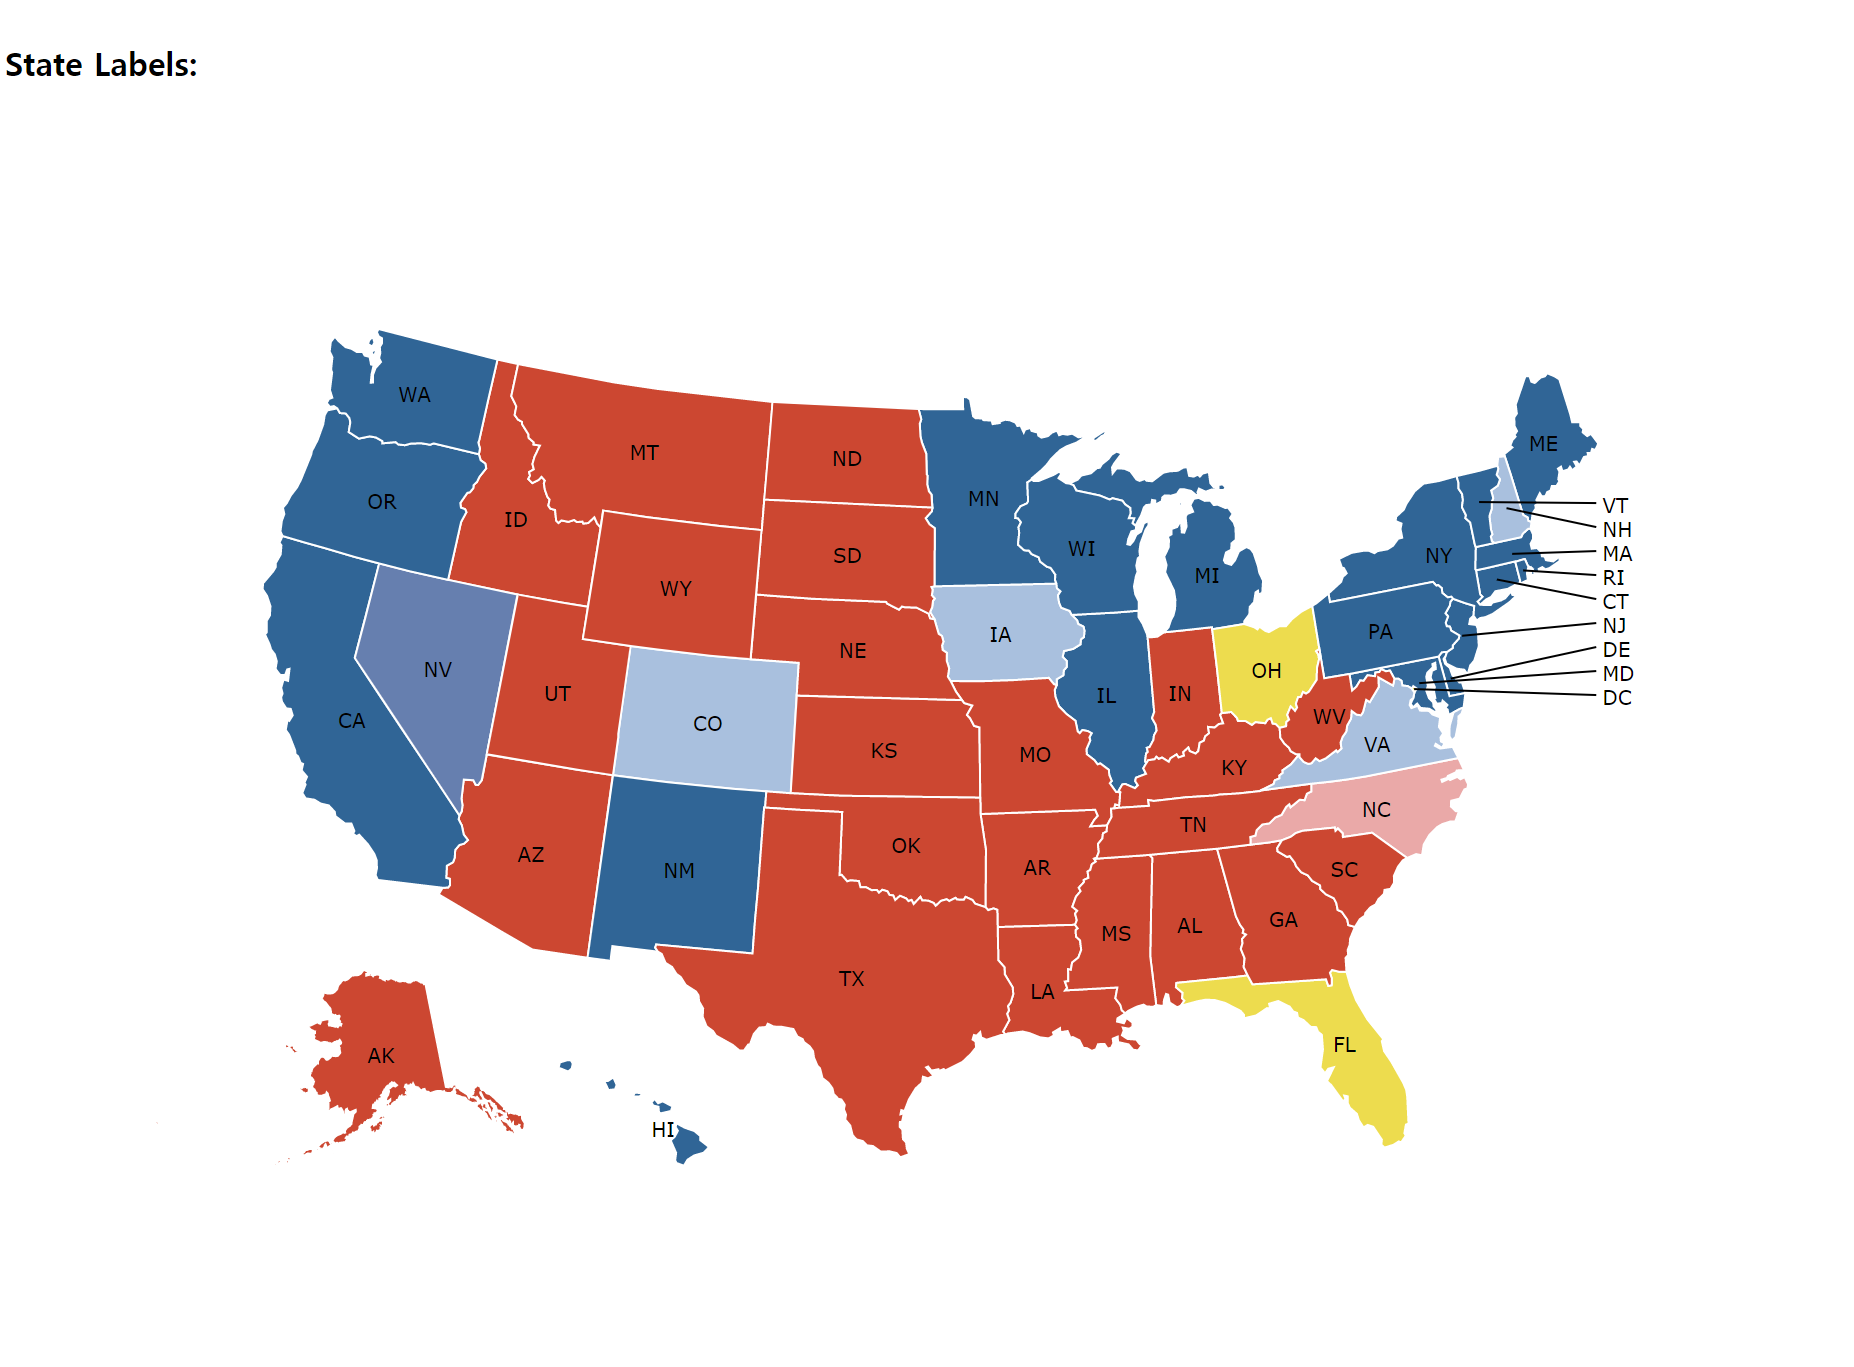
<h4>State Labels:</h4>
<vue-datamaps
labels
:scope="scope"
:geographyConfig="geographyConfig"
:fills="fills"
:data="data"
popupTemplate
@custom:popup="popupTemplate"
>
<div slot="hoverinfo" class="hoverinfo" style="white-space: pre-line;">
{{ popupData }}
</div>
</vue-datamaps>
</div>
</template>
<script>
import { VueDatamaps } from 'vue-datamaps'
export default {
components: {
VueDatamaps
},
data () {
return {
scope: 'usa',
geographyConfig: {
highlightBorderColor: '#bada55',
highlightBorderWidth: 3
},
fills: {
'Republican': '#CC4731',
'Democrat': '#306596',
'Heavy Democrat': '#667FAF',
'Light Democrat': '#A9C0DE',
'Heavy Republican': '#CA5E5B',
'Light Republican': '#EAA9A8',
defaultFill: '#EDDC4E'
},
data: {
'AZ': {
'fillKey': 'Republican',
'electoralVotes': 5
},
'CO': {
'fillKey': 'Light Democrat',
'electoralVotes': 5
},
'DE': {
'fillKey': 'Democrat',
'electoralVotes': 32
},
'FL': {
'fillKey': 'UNDECIDED',
'electoralVotes': 29
},
'GA': {
'fillKey': 'Republican',
'electoralVotes': 32
},
'HI': {
'fillKey': 'Democrat',
'electoralVotes': 32
},
'ID': {
'fillKey': 'Republican',
'electoralVotes': 32
},
'IL': {
'fillKey': 'Democrat',
'electoralVotes': 32
},
'IN': {
'fillKey': 'Republican',
'electoralVotes': 11
},
'IA': {
'fillKey': 'Light Democrat',
'electoralVotes': 11
},
'KS': {
'fillKey': 'Republican',
'electoralVotes': 32
},
'KY': {
'fillKey': 'Republican',
'electoralVotes': 32
},
'LA': {
'fillKey': 'Republican',
'electoralVotes': 32
},
'MD': {
'fillKey': 'Democrat',
'electoralVotes': 32
},
'ME': {
'fillKey': 'Democrat',
'electoralVotes': 32
},
'MA': {
'fillKey': 'Democrat',
'electoralVotes': 32
},
'MN': {
'fillKey': 'Democrat',
'electoralVotes': 32
},
'MI': {
'fillKey': 'Democrat',
'electoralVotes': 32
},
'MS': {
'fillKey': 'Republican',
'electoralVotes': 32
},
'MO': {
'fillKey': 'Republican',
'electoralVotes': 13
},
'MT': {
'fillKey': 'Republican',
'electoralVotes': 32
},
'NC': {
'fillKey': 'Light Republican',
'electoralVotes': 32
},
'NE': {
'fillKey': 'Republican',
'electoralVotes': 32
},
'NV': {
'fillKey': 'Heavy Democrat',
'electoralVotes': 32
},
'NH': {
'fillKey': 'Light Democrat',
'electoralVotes': 32
},
'NJ': {
'fillKey': 'Democrat',
'electoralVotes': 32
},
'NY': {
'fillKey': 'Democrat',
'electoralVotes': 32
},
'ND': {
'fillKey': 'Republican',
'electoralVotes': 32
},
'NM': {
'fillKey': 'Democrat',
'electoralVotes': 32
},
'OH': {
'fillKey': 'UNDECIDED',
'electoralVotes': 32
},
'OK': {
'fillKey': 'Republican',
'electoralVotes': 32
},
'OR': {
'fillKey': 'Democrat',
'electoralVotes': 32
},
'PA': {
'fillKey': 'Democrat',
'electoralVotes': 32
},
'RI': {
'fillKey': 'Democrat',
'electoralVotes': 32
},
'SC': {
'fillKey': 'Republican',
'electoralVotes': 32
},
'SD': {
'fillKey': 'Republican',
'electoralVotes': 32
},
'TN': {
'fillKey': 'Republican',
'electoralVotes': 32
},
'TX': {
'fillKey': 'Republican',
'electoralVotes': 32
},
'UT': {
'fillKey': 'Republican',
'electoralVotes': 32
},
'WI': {
'fillKey': 'Democrat',
'electoralVotes': 32
},
'VA': {
'fillKey': 'Light Democrat',
'electoralVotes': 32
},
'VT': {
'fillKey': 'Democrat',
'electoralVotes': 32
},
'WA': {
'fillKey': 'Democrat',
'electoralVotes': 32
},
'WV': {
'fillKey': 'Republican',
'electoralVotes': 32
},
'WY': {
'fillKey': 'Republican',
'electoralVotes': 32
},
'CA': {
'fillKey': 'Democrat',
'electoralVotes': 32
},
'CT': {
'fillKey': 'Democrat',
'electoralVotes': 32
},
'AK': {
'fillKey': 'Republican',
'electoralVotes': 32
},
'AR': {
'fillKey': 'Republican',
'electoralVotes': 32
},
'AL': {
'fillKey': 'Republican',
'electoralVotes': 32
}
},
popupData: ''
}
},
methods: {
popupTemplate ({ geography, datum }) {
this.popupData = `${geography.properties.name}\nElectoral Votes: ${datum.electoralVotes}`
}
}
}
</script>
<style>
</style>
<template>
<div>
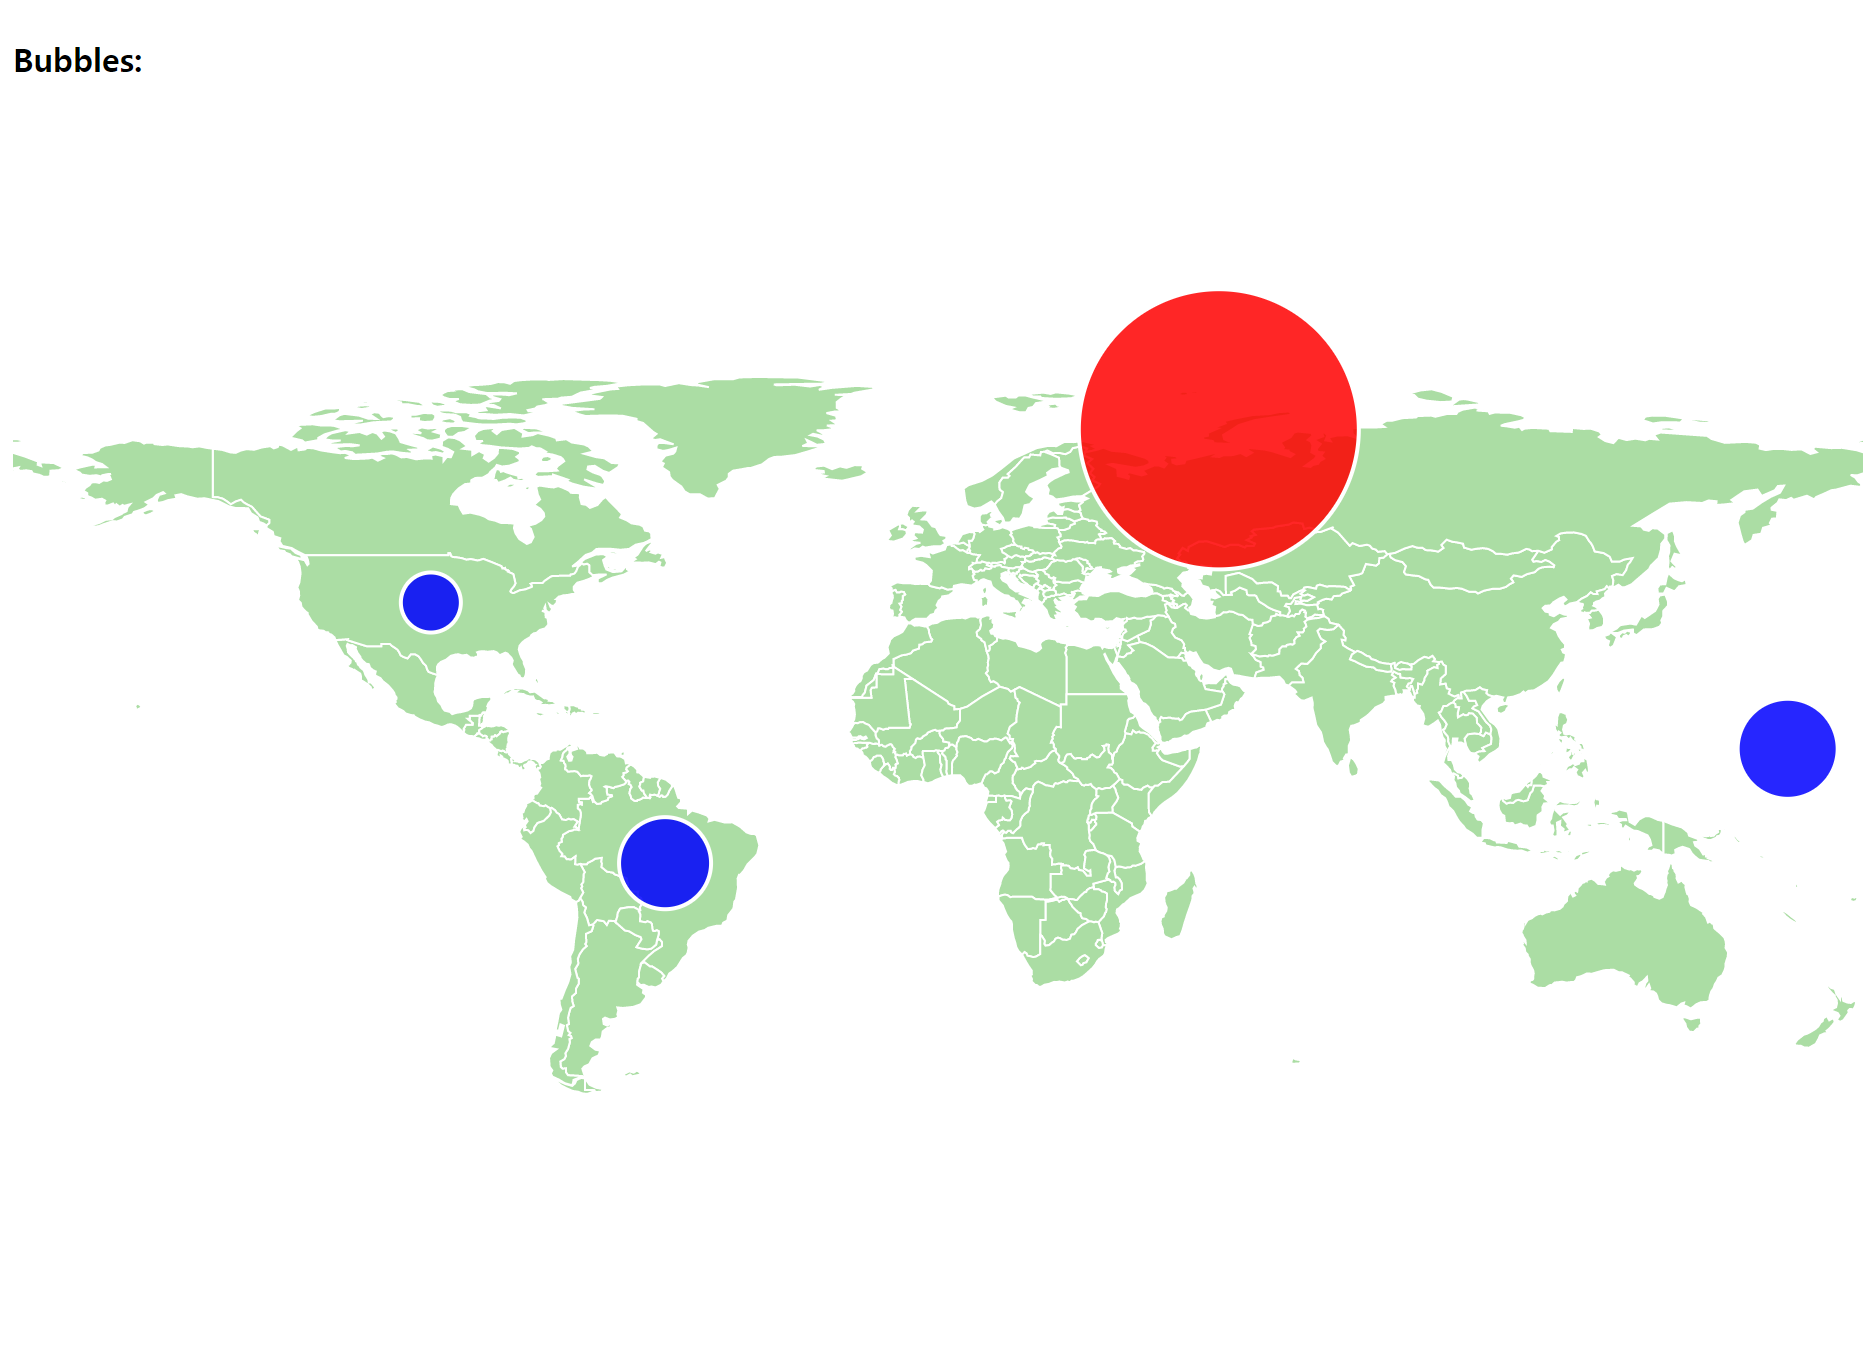
<h4>Bubbles:</h4>
<vue-datamaps
:geographyConfig="geographyConfig"
:bubblesConfig="bubblesConfig"
:fills="fills"
@custom:popup-bubble="popupTemplate"
bubbles
>
<div slot="hoverBubbleInfo" class="hoverinfo" style="text-align:center;">
<b>Yield</b>: {{ popupData.yeild }}<br>
Exploded on {{ popupData.date }} by the {{ popupData.country }}
</div>
</vue-datamaps>
</div>
</template>
<script>
import { VueDatamaps } from 'vue-datamaps'
export default {
components: {
VueDatamaps
},
data () {
return {
geographyConfig: {
popupOnHover: true,
highlightOnHover: true
},
fills: {
defaultFill: '#ABDDA4',
USA: 'blue',
RUS: 'red'
},
bubblesConfig: {
popupTemplate: true,
data: [
{
name: 'Not a bomb, but centered on Brazil',
radius: 23,
centered: 'BRA',
country: 'USA',
yeild: 0,
fillKey: 'USA',
date: '1954-03-01'
},
{
name: 'Not a bomb',
radius: 15,
yeild: 0,
country: 'USA',
centered: 'USA',
date: '1986-06-05',
significance: 'Centered on US',
fillKey: 'USA'
},
{
name: 'Castle Bravo',
radius: 25,
yeild: 15000,
country: 'USA',
significance: 'First dry fusion fuel "staged" thermonuclear weapon; a serious nuclear fallout accident occurred',
fillKey: 'USA',
date: '1954-03-01',
latitude: 11.415,
longitude: 165.1619
}, {
name: 'Tsar Bomba',
radius: 70,
yeild: 50000,
country: 'USSR',
fillKey: 'RUS',
significance: 'Largest thermonuclear weapon ever tested—scaled down from its initial 100 Mt design by 50%',
date: '1961-10-31',
latitude: 73.482,
longitude: 54.5854
}
]
},
popupData: {
yeild: '',
date: '',
country: ''
}
}
},
methods: {
popupTemplate ({ datum }) {
this.popupData = {
yeild: datum.yeild,
date: datum.date,
country: datum.country
}
}
}
}
</script>
<style>
</style>
<template>
<div>
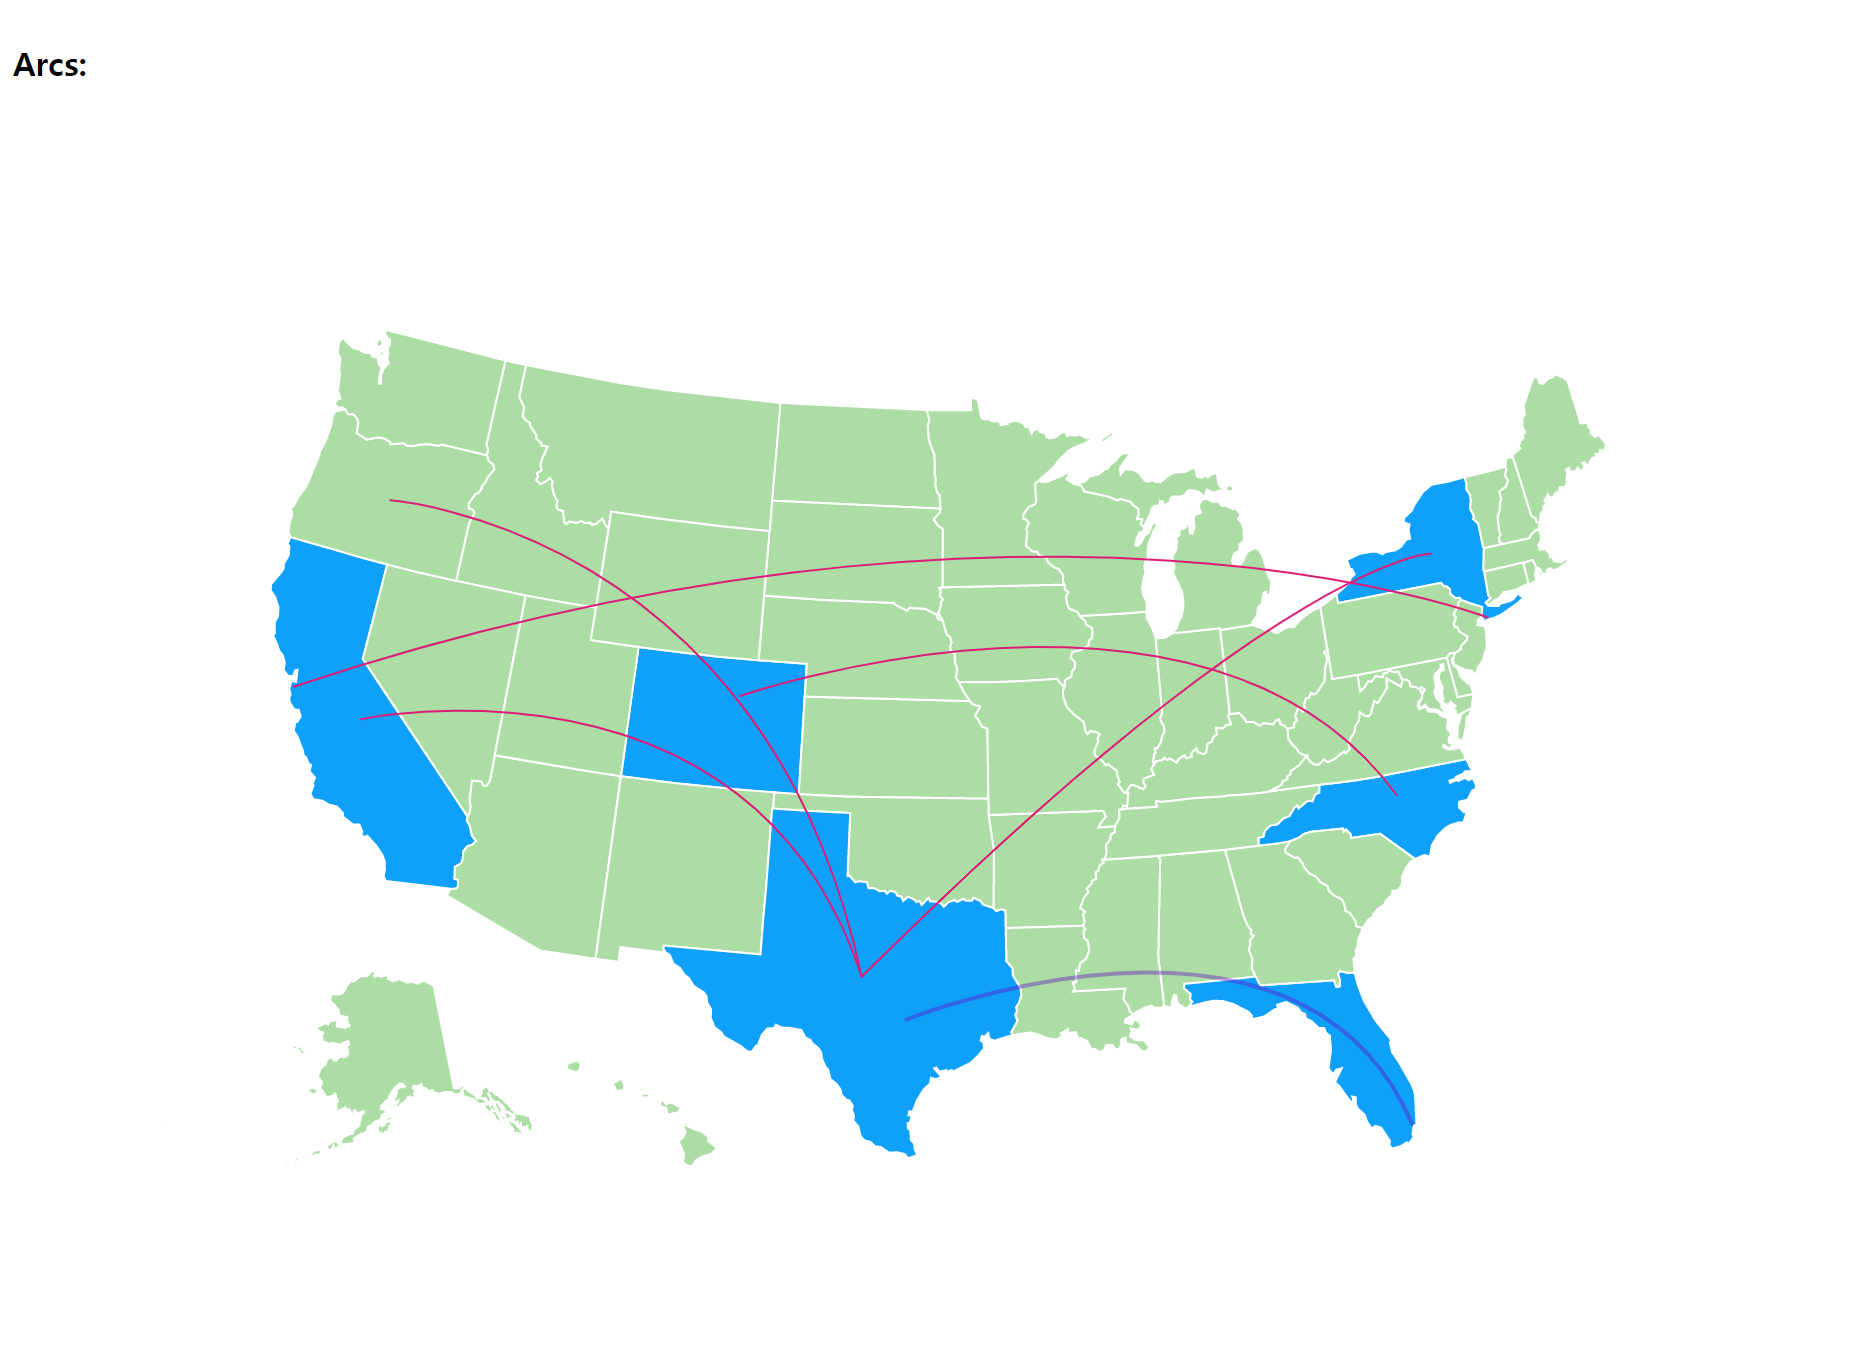
<h4>Arcs:</h4>
<vue-datamaps
:scope="scope"
:fills="fills"
:data="data"
:geographyConfig="geographyConfig"
:arcConfig="arcConfig"
arc
/>
</div>
</template>
<script>
import { VueDatamaps } from 'vue-datamaps'
export default {
components: {
VueDatamaps
},
data () {
return {
geographyConfig: {
popupOnHover: true,
highlightOnHover: true
},
scope: 'usa',
fills: {
defaultFill: '#ABDDA4',
win: '#0fa0fa'
},
data: {
'TX': { fillKey: 'win' },
'FL': { fillKey: 'win' },
'NC': { fillKey: 'win' },
'CA': { fillKey: 'win' },
'NY': { fillKey: 'win' },
'CO': { fillKey: 'win' }
},
arcConfig: {
popupOnHover: true,
data: [
{
origin: 'CA',
destination: 'TX'
},
{
origin: 'OR',
destination: 'TX'
},
{
origin: 'NY',
destination: 'TX'
},
{
origin: {
latitude: 40.639722,
longitude: -73.778889
},
destination: {
latitude: 37.618889,
longitude: -122.375
}
},
{
origin: {
latitude: 30.194444,
longitude: -97.67
},
destination: {
latitude: 25.793333,
longitude: -80.290556
},
options: {
strokeWidth: 2,
strokeColor: 'rgba(100, 10, 200, 0.4)',
greatArc: true
}
},
{
origin: {
latitude: 39.861667,
longitude: -104.673056
},
destination: {
latitude: 35.877778,
longitude: -78.7875
}
}
],
strokeWidth: 1,
arcSharpness: 1.4
}
}
}
}
</script>
<style>
</style>
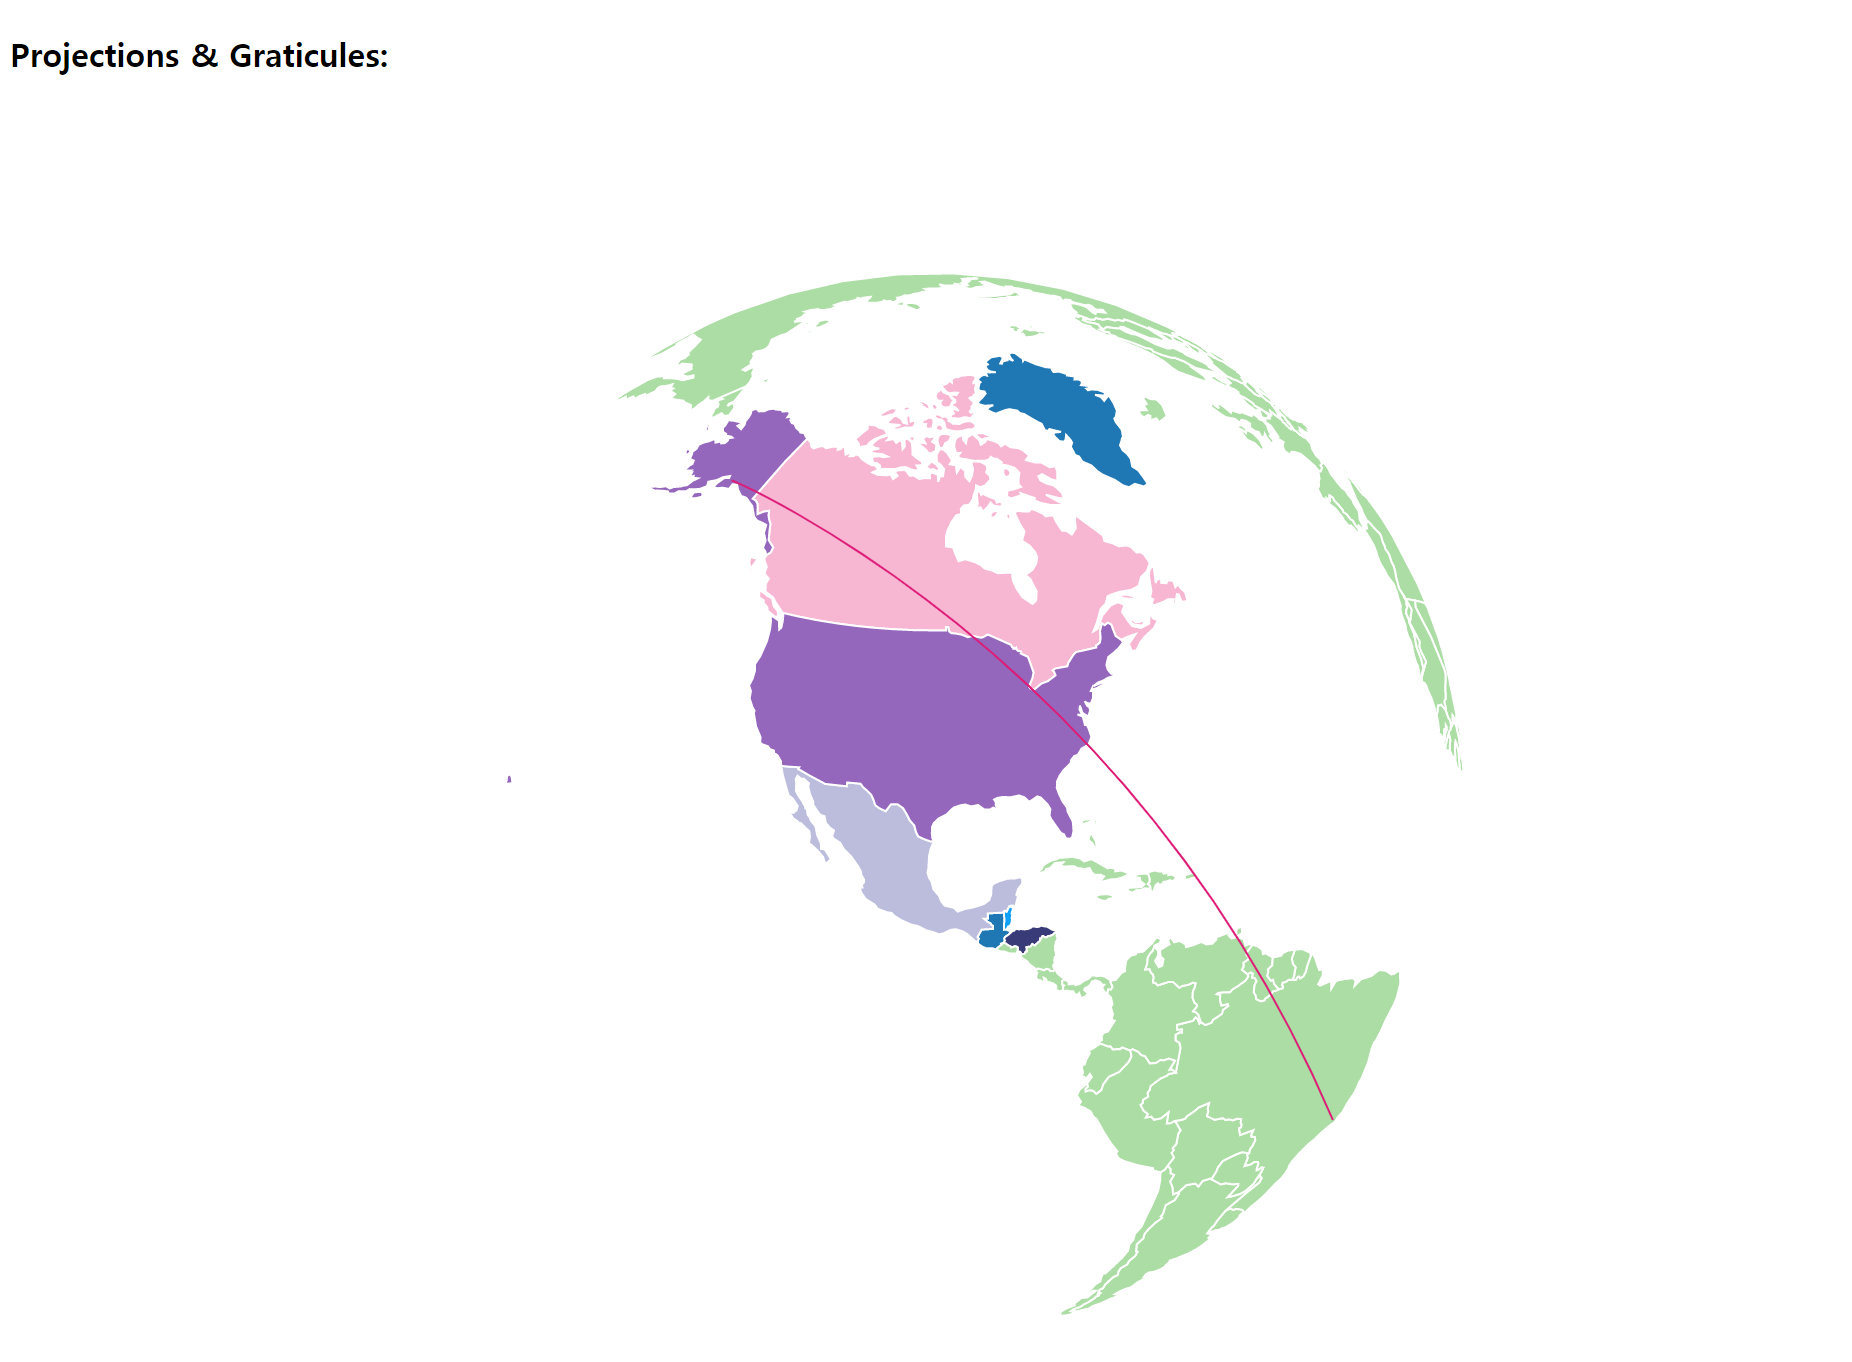
<template>
  <div>
    <h4>Projections & Graticules:</h4>
    <vue-datamaps
      :scope="scope"
      :projection="projection"
      :projectionConfig="projectionConfig"
      :fills="fills"
      :data="data"
      :arcConfig="arcConfig"
      arc
    />
  </div>
</template>

<script>
import { VueDatamaps } from 'vue-datamaps'
import * as d3 from 'd3v4'
export default {
  components: {
    VueDatamaps
  },
  data () {
    return {
      scope: 'world',
      projection: 'Orthographic',
      fills: {
        defaultFill: '#ABDDA4',
        gt50: d3.schemeCategory20[Math.floor(Math.random() * 20)],
        eq50: d3.schemeCategory20b[Math.floor(Math.random() * 20)],
        lt25: d3.schemeCategory20c[Math.floor(Math.random() * 20)],
        gt75: d3.schemeCategory20[Math.floor(Math.random() * 20)],
        lt50: d3.schemeCategory10[Math.floor(Math.random() * 10)],
        eq0: d3.schemeCategory10[Math.floor(Math.random() * 1)],
        pink: '#0fa0fa',
        gt500: d3.schemeCategory10[Math.floor(Math.random() * 1)]
      },
      data: {
        'USA': { fillKey: 'lt50' },
        'MEX': { fillKey: 'lt25' },
        'CAN': { fillKey: 'gt50' },
        'GTM': { fillKey: 'gt500' },
        'HND': { fillKey: 'eq50' },
        'BLZ': { fillKey: 'pink' },
        'GRL': { fillKey: 'eq0' }
      },
      projectionConfig: {
        rotation: [97, -30]
      },
      arcConfig: {
        popupOnHover: false,
        data: [
          {
            origin: {
              latitude: 61,
              longitude: -149
            },
            destination: {
              latitude: -22,
              longitude: -43
            }
          }
        ],
        greatArc: true,
        animationSpeed: 2000
      }
    }
  }
}
</script>

<style>

</style>
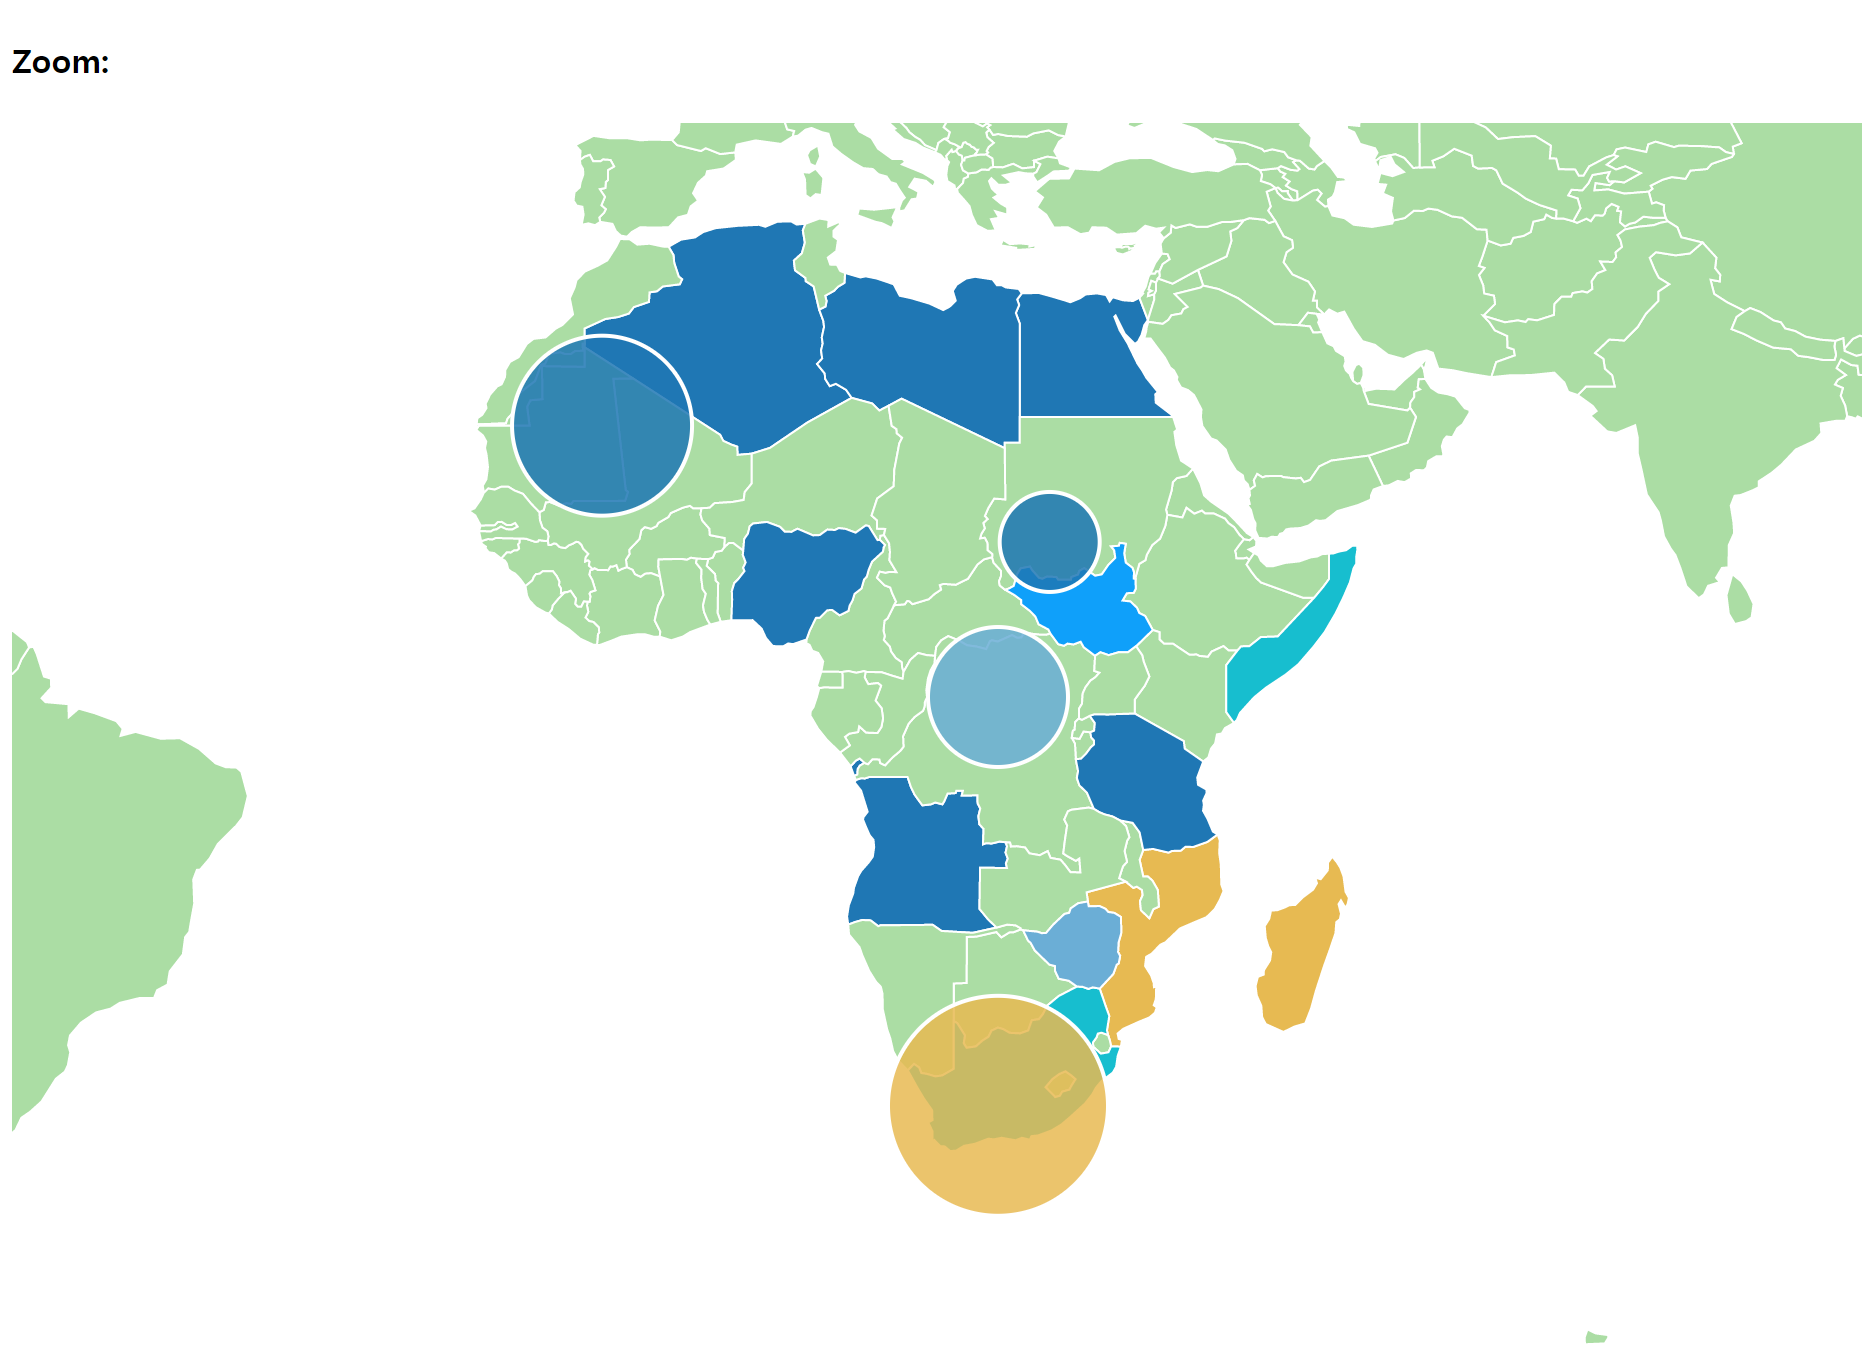
<template>
  <div>
    <h4>Zoom:</h4>
    <vue-datamaps
      :scope="scope"
      :data="data"
      :fills="fills"
      :bubblesConfig="bubblesConfig"
      bubbles
      @custom:popup-bubble="popupTemplate"
      :setProjection="setProjection('zoom')"
    >
      <div slot="hoverBubbleInfo" class="hoverinfo" style="text-align:center;">
        {{ popupData.name }}
      </div>
    </vue-datamaps>
  </div>
</template>

<script>
import { VueDatamaps } from 'vue-datamaps'
import * as d3 from 'd3v4'
export default {
  components: {
    VueDatamaps
  },
  data () {
    return {
      scope: 'world',
      fills: {
        defaultFill: '#ABDDA4',
        gt50: d3.schemeCategory20[Math.floor(Math.random() * 20)],
        eq50: d3.schemeCategory20b[Math.floor(Math.random() * 20)],
        lt25: d3.schemeCategory20c[Math.floor(Math.random() * 20)],
        gt75: d3.schemeCategory20[Math.floor(Math.random() * 20)],
        lt50: d3.schemeCategory10[Math.floor(Math.random() * 10)],
        eq0: d3.schemeCategory10[Math.floor(Math.random() * 1)],
        pink: '#0fa0fa',
        gt500: d3.schemeCategory10[Math.floor(Math.random() * 1)]
      },
      data: {
        'ZAF': { fillKey: 'gt50' },
        'ZWE': { fillKey: 'lt25' },
        'NGA': { fillKey: 'lt50' },
        'MOZ': { fillKey: 'eq50' },
        'MDG': { fillKey: 'eq50' },
        'EGY': { fillKey: 'gt75' },
        'TZA': { fillKey: 'gt75' },
        'LBY': { fillKey: 'eq0' },
        'DZA': { fillKey: 'gt500' },
        'SSD': { fillKey: 'pink' },
        'SOM': { fillKey: 'gt50' },
        'GIB': { fillKey: 'eq50' },
        'AGO': { fillKey: 'lt50' }
      },
      bubblesConfig: {
        popupOnHover: true,
        popupTemplate: true,
        data: [
          { name: 'Bubble 1', latitude: 21.32, longitude: -7.32, radius: 45, fillKey: 'gt500' },
          { name: 'Bubble 2', latitude: 12.32, longitude: 27.32, radius: 25, fillKey: 'eq0' },
          { name: 'Bubble 3', latitude: 0.32, longitude: 23.32, radius: 35, fillKey: 'lt25' },
          { name: 'Bubble 4', latitude: -31.32, longitude: 23.32, radius: 55, fillKey: 'eq50' }
        ]
      },
      popupData: {
        name: ''
      }
    }
  },
  methods: {
    popupTemplate ({ datum }) {
      this.popupData.name = `Bubble for ${datum.name}`
    },
    setProjection (type) {
      const createProjection = {
        korea: function (d3, element) {
          const projection = d3.geoMercator().center([0, 0])
            .rotate([-128, -36])
            .scale(element.offsetWidth * 6)
            .translate([element.offsetWidth / 2, element.offsetHeight / 2])
          const path = d3.geoPath().projection(projection)
          return { projection, path }
        },
        zoom: function (d3, element) {
          var projection = d3.geoEquirectangular()
            .center([23, -3])
            .rotate([4.4, 0])
            .scale(element.offsetHeight * 0.6)
            .translate([element.offsetWidth / 2, element.offsetHeight / 2])
          var path = d3.geoPath()
            .projection(projection)
          return { path: path, projection: projection }
        }
      }
      return createProjection[type]
    }
  }
}
</script>

<style>

</style>
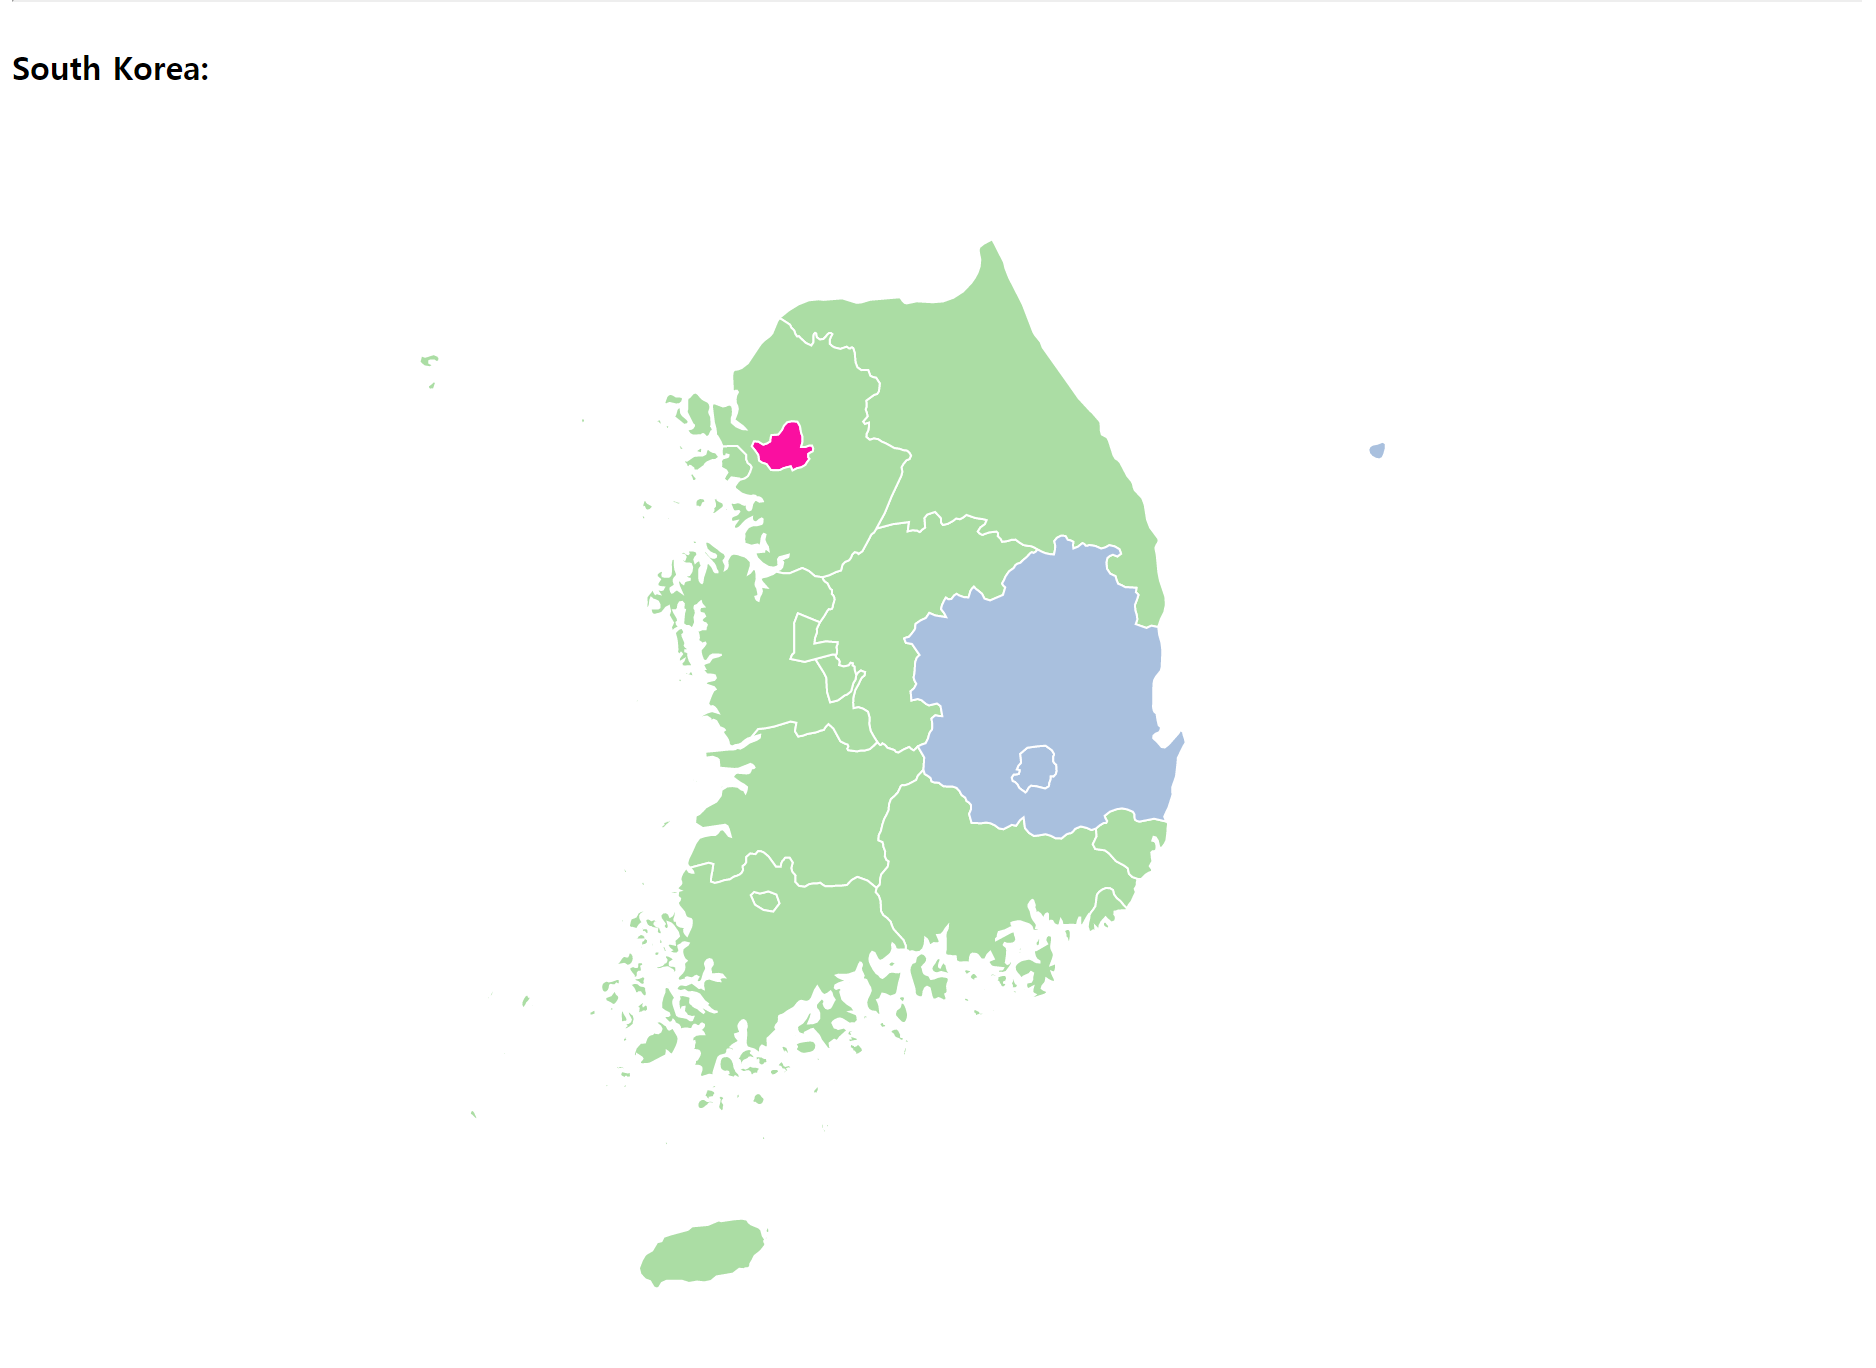
<template>
  <div>
    <h4>South Korea:</h4>
    <vue-datamaps
        :scope="scope"
        :setProjection="setProjection('korea')"
        :fills="fills"
        :data="data"
    />
  </div>
</template>

<script>
import { VueDatamaps } from 'vue-datamaps'
export default {
  components: {
    VueDatamaps
  },
  data () {
    return {
      scope: 'kor',
      fills: {
        color1: '#fa0fa0',
        color2: '#A9C0DE'
      },
      data: {
        'KR.SO': {
          fillKey: 'color1'
        },
        'KR.TG': {
          fillKey: 'color2'
        }
      }
    }
  },
  methods: {
    setProjection (type) {
      const createProjection = {
        korea: function (d3, element) {
          const projection = d3.geoMercator().center([0, 0])
            .rotate([-128, -36])
            .scale(element.offsetWidth * 6)
            .translate([element.offsetWidth / 2, element.offsetHeight / 2])
          const path = d3.geoPath().projection(projection)
          return { projection, path }
        },
        zoom: function (d3, element) {
          var projection = d3.geoEquirectangular()
            .center([23, -3])
            .rotate([4.4, 0])
            .scale(element.offsetHeight * 0.6)
            .translate([element.offsetWidth / 2, element.offsetHeight / 2])
          var path = d3.geoPath()
            .projection(projection)
          return { path: path, projection: projection }
        }
      }
      return createProjection[type]
    }
  }
}
</script>

<style>

</style>
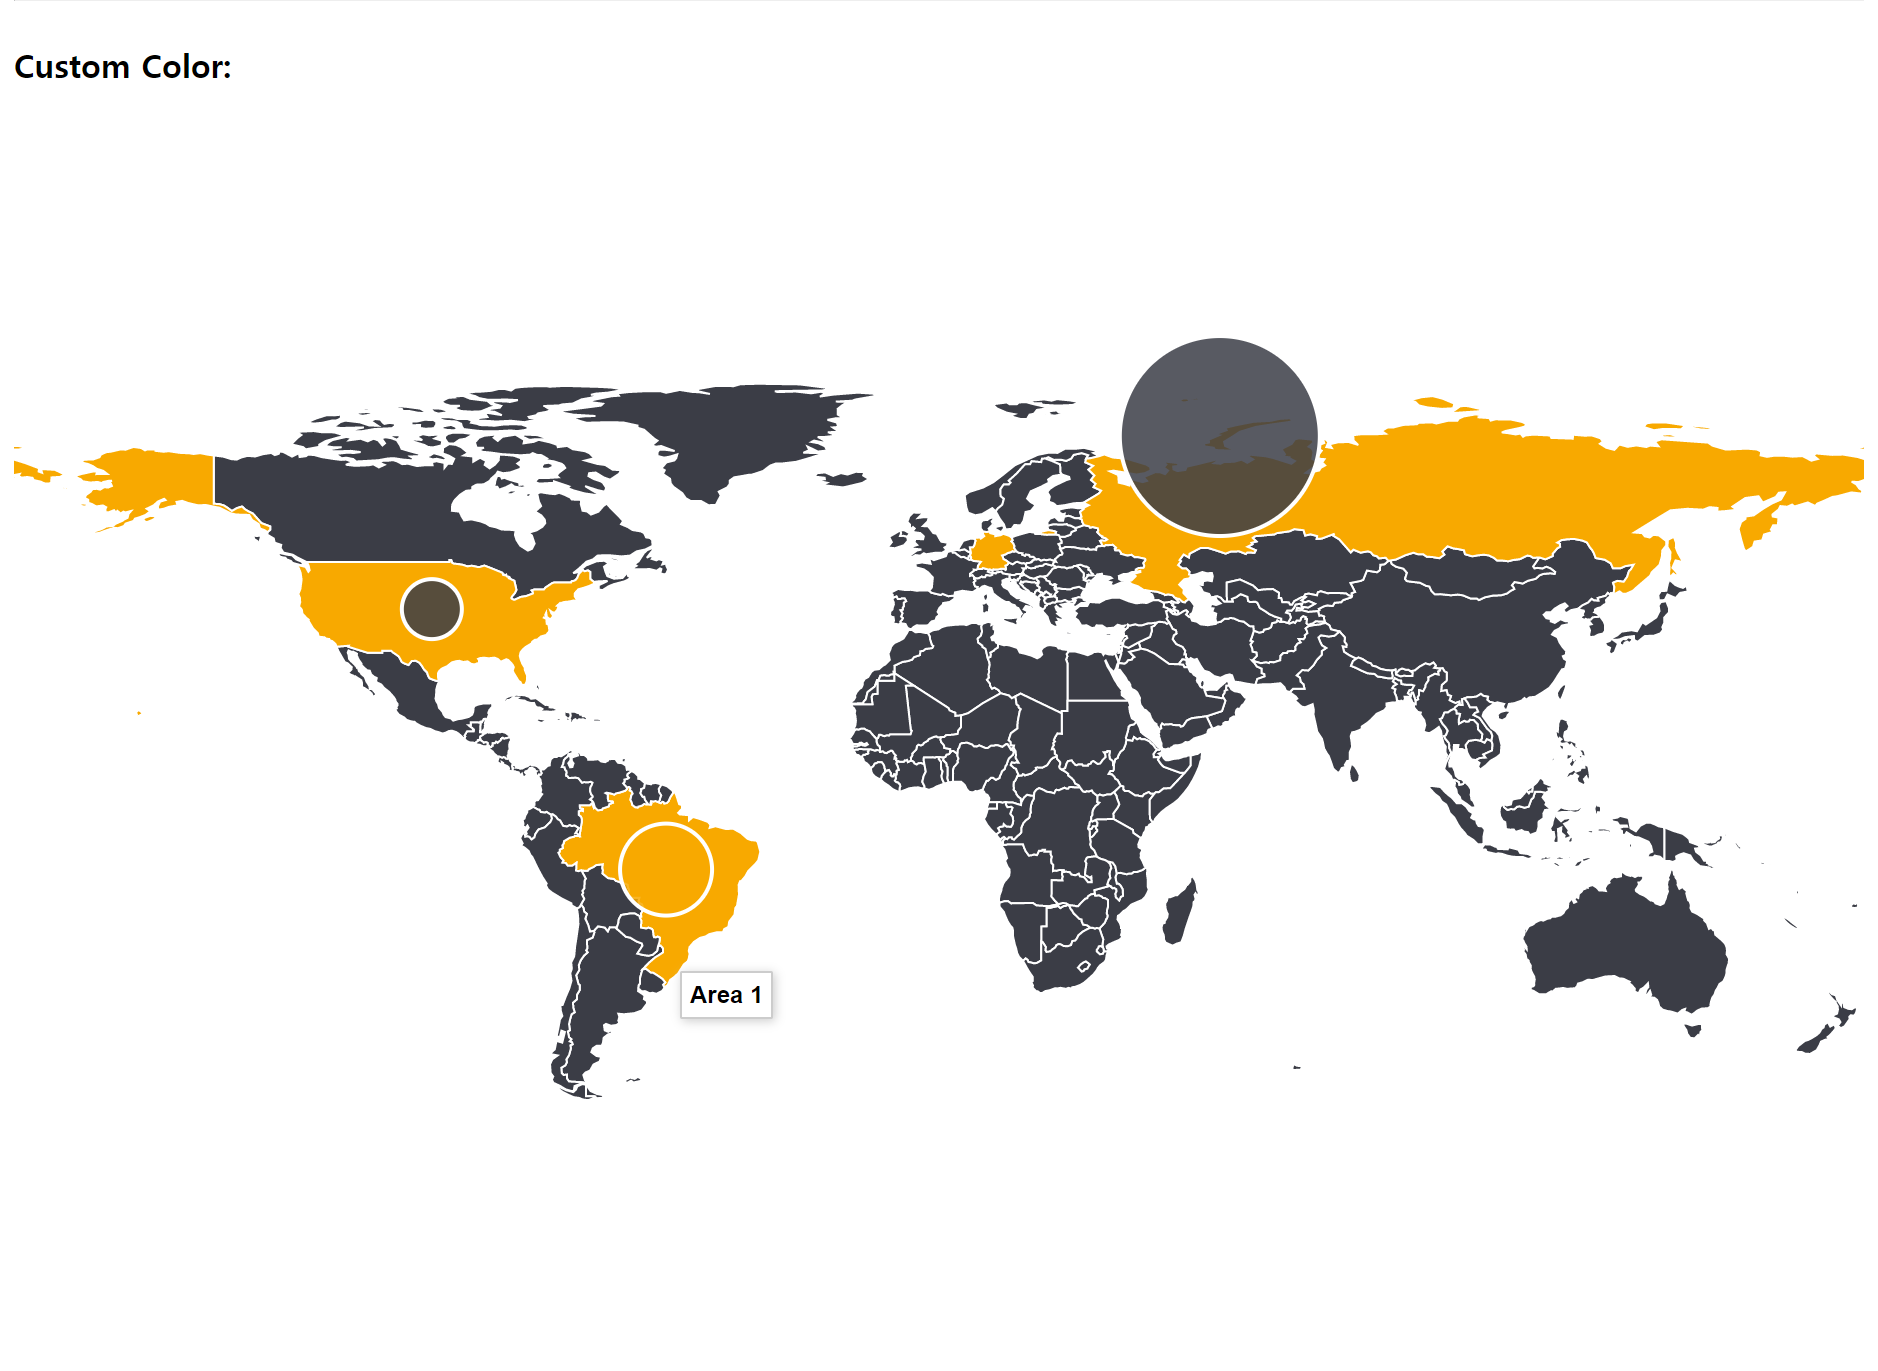
<template>
    <div>
        <h4>Custom Color:</h4>
        <vue-datamaps
            :fills="fills"
            :data="data"
            :geographyConfig="geographyConfig"
            bubbles
            :bubblesConfig="bubblesConfig"
        />
    </div>
</template>

<script>
import { VueDatamaps } from 'vue-datamaps'
export default {
  components: {
    VueDatamaps
  },
  data () {
    return {
      bubblesConfig: {
        data: [
          {
            name: 'Area 1',
            radius: 23,
            centered: 'BRA'
          },
          {
            name: 'Area 2',
            radius: 15,
            centered: 'USA'
          },
          {
            name: 'Area 3',
            radius: 50,
            latitude: 73.482,
            longitude: 54.5854
          }
        ],
        highlightBorderColor: '#FFFFFF',
        highlightFillColor: '#F8A900'
      },
      geographyConfig: {
        popupOnHover: false,
        highlightOnHover: false,
        borderWidth: 0
      },
      data: {
        USA: { fillKey: 'active' },
        RUS: { fillKey: 'active' },
        DEU: { fillKey: 'active' },
        BRA: { fillKey: 'active' }
      },
      fills: {
        defaultFill: '#3B3D46',
        active: '#F8A900'
      }
    }
  }
}
</script>

<style>

</style>
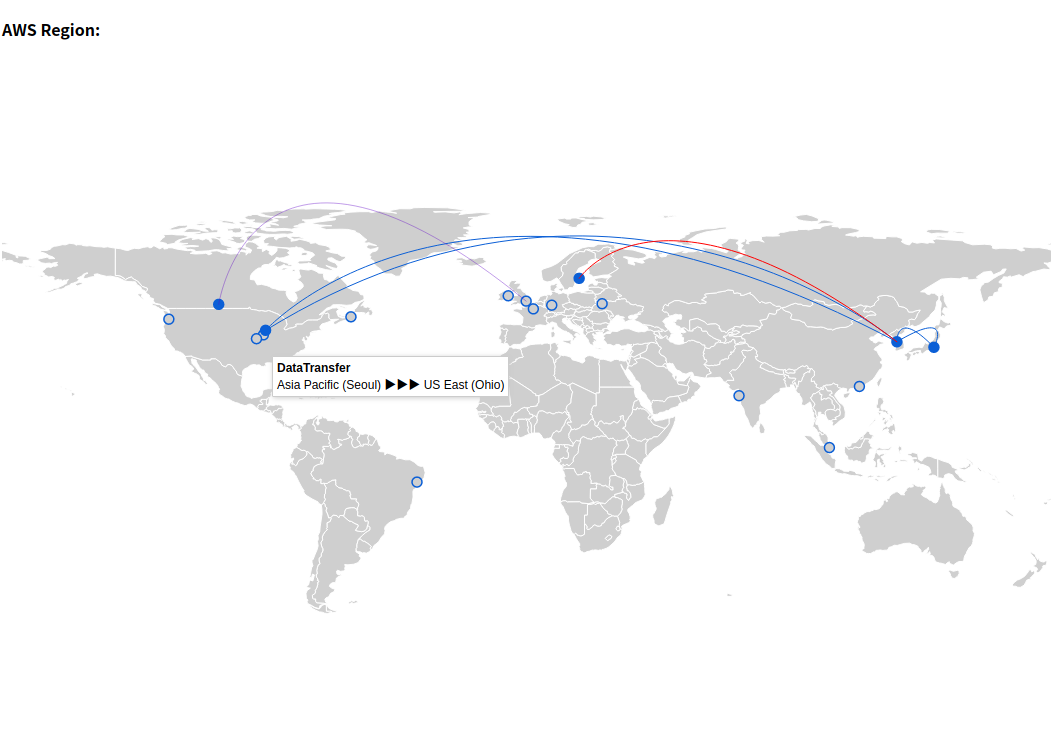
<template>
  <div>
    <h4>AWS Region:</h4>
    <vue-datamaps
        :geographyConfig="geographyConfig"
        :fills="fills"
        :arcConfig="arcConfig"
        arc
        aws-regions
        :awsRegionsConfig="awsRegionsConfig"
        @custom:popup-arc="popupTemplate"
    >
      <div slot="hoverArcInfo" class="hoverinfo">
        <strong>{{ popupData.title }}</strong><br>
        {{ popupData.origin }} ▶▶▶ {{ popupData.destination }}
      </div>
    </vue-datamaps>
  </div>
</template>

<script>
import { VueDatamaps } from 'vue-datamaps'
export default {
  components: {
    VueDatamaps
  },
  data () {
    return {
      geographyConfig: {
        dataUrl: '',
        popupOnHover: false,
        highlightOnHover: false
      },
      fills: {
        defaultFill: '#cfcfcf',
        active: '#0b5fd6'
      },
      awsRegionsConfig: {
        popupOnHover: true,
        data: [
          {
            code: 'ap-northeast-2',
            fillKey: 'active'
          },
          { code: 'ap-northeast-1',
            fillKey: 'active'
          },
          { code: 'us-east-2',
            fillKey: 'active'
          },
          { code: 'eu-north-1',
            fillKey: 'active'
          },
          { code: 'ca-central-1',
            fillKey: 'active'
          }
        ]
      },
      arcConfig: {
        popupOnHover: true,
        popupTemplate: true,
        data: [
          {
            origin: 'ap-northeast-2',
            destination: 'ap-northeast-1',
            options: {
              arcSharpness: 0.5
            }
          },
          {
            origin: 'ap-northeast-1',
            destination: 'ap-northeast-2',
            options: {
              arcSharpness: 0.5
            }
          },
          {
            origin: 'us-east-2',
            destination: 'ap-northeast-2',
            options: {
              arcSharpness: 3
            }
          },
          {
            origin: 'ap-northeast-2',
            destination: 'us-east-2',
            options: {
              arcSharpness: 3
            }
          },
          {
            origin: 'eu-north-1',
            destination: 'ap-northeast-2',
            options: {
              strokeColor: 'red',
              arcSharpness: 2
            }
          },
          {
            origin: 'ca-central-1',
            destination: 'eu-west-2',
            options: {
              strokeColor: 'rgba(100, 10, 200, 0.4)',
              arcSharpness: 3
            }
          }
        ],
        strokeColor: '#0b5fd6',
        greatArc: true,
        animationSpeed: 2000
      },
      popupData: {
        title: 'DataTransfer',
        origin: '',
        destination: ''
      }
    }
  },
  methods: {
    popupTemplate (datum) {
      this.popupData.origin = datum.origin.full_name
      this.popupData.destination = datum.destination.full_name
    }
  }
}
</script>

<style>

</style>
Available Props Option
scope
- type: String
- value: world, usa, custom_map
Same as the original.
setProjection
- type: Function
- value: See sample code.
Same as original but d3 version different.
projection
- type: String
- value: Equirectangular, Orthographic, Mercator
Same as original but PascalCase.
dataType
- type: String
- value json, csv
Same as original.
data
- type: Object
- value: See sample code.
Same as original.
done
- type: Function
Not implemented.
fills
- type: Object
- value: The keys in this object map to the "fillKey" of [data] or [data of bubbles]
Same as original.
geographyConfig
- type: Object
- value: See sample code.
Same as original but not include popupTemplate.
bubblesConfig
- type: Object
- value: See sample code.
Same as original but not include popupTemplate.
bubbles
- type: Boolean
- value: true, false If
bubblesConfigrequired.
arcConfig
- type: Object
- value: See sample code.
Same as original but not include popupTemplate.
arc
- type: Boolean
- value: true, false
If arcConfig required.
disableDefaultStyles
- type: Boolean
- value: true, false
Not implemented.
labelsConfig
- type: Object
- value: See sample code.
Same as original.
labels
- type: Boolean
- value: true, false
If labelsConfig required.
popupTemplate
- type: Boolean
- value: true, false
If slot hoverinfo and event custom:popup||custom:popup-bubble||custom:popup-arc||custom:popup-region|| required.
Default Props Option
{
  scope: 'world',
  setProjection: (d3, element) => {
    let projection = null
    let path = null
    if (this.scope === 'usa') {
        projection = d3.geoAlbersUsa()
            .scale(this.svgWidth)
            .translate([this.svgWidth / 2, this.svgHeight / 2])
    } else if (this.scope === 'world') {
        projection = d3[`geo${this.projection}`]()
            .scale((this.svgWidth + 1) / 2 / Math.PI)
            .translate([this.svgWidth / 2, this.svgHeight / (this.projection === 'Mercator' ? 1.45 : 1.8)])
    }
    if (this.projection === 'Orthographic') {
        this.svg.append('defs').append('path')
            .datum({ type: 'Sphere' })
            .attr('id', 'sphere')
            .attr('d', path)

        this.svg.append('use')
            .attr('class', 'stroke')
            .attr('xlink:href', '#sphere')

        this.svg.append('use')
            .attr('class', 'fill')
            .attr('xlink:href', '#sphere')
        projection.scale(this.svgWidth / Math.PI * 0.9).clipAngle(90).rotate(this.projectionConfigOptions.rotation)
    }

    path = d3.geoPath()
        .projection(projection)
    return { projection, path }
  },
  projection: 'Equirectangular',
  dataType: 'json',
  data: {},
  done: function () {
    return {}
  },
  fills: {
    authorHasTraveledTo: '#fa0fa0',
    defaultFill: '#ABDDA4'
  },
  geographyConfig: {
    dataUrl: null,
    hideAntarctica: true,
    hideHawaiiAndAlaska: false,
    borderWidth: 1,
    borderOpacity: 1,
    borderColor: '#FDFDFD',
    popupOnHover: true,
    highlightOnHover: true,
    highlightFillColor: '#FC8D59',
    highlightBorderColor: 'rgba(250, 15, 160, 0.2)',
    highlightBorderWidth: 2,
    highlightBorderOpacity: 1,
    highlightFillOpacity: 0.85
  },
  projectionConfig: {
    rotation: [97, 0]
  },
  bubblesConfig: {
    borderWidth: 2,
    borderOpacity: 1,
    borderColor: '#FFFFFF',
    popupOnHover: true,
    radius: null,
    fillOpacity: 0.75,
    animate: true,
    highlightOnHover: true,
    highlightFillColor: '#FC8D59',
    highlightBorderColor: 'rgba(250, 15, 160, 0.2)',
    highlightBorderWidth: 2,
    highlightBorderOpacity: 1,
    highlightFillOpacity: 0.85,
    exitDelay: 100,
    key: JSON.stringify,
    data: []
  },
  bubbles: false,
  arcConfig: {
    strokeColor: '#DD1C77',
    strokeWidth: 1,
    arcSharpness: 1,
    animationSpeed: 600,
    popupOnHover: false,
    data: []
  },
  arc: false,
  disableDefaultStyles: false,
  labelsConfig: {
    fontSize: 10,
    fontFamily: 'Verdana',
    labelColor: '#000',
    lineWidth: 1
  },
  labels: false,
  popupTemplate: false,
  awsRegions: false,
  awsRegionsConfig: {
    strokeColor: '#0b5fd6',
    strokeWidth: 1.5,
    defaultFill: 'transparent',
    highlightFillOpacity: 1,
    showPrivateRegions: false,
    popupOnHover: false,
    data: []
  }
}
Slot & Event for @mouseover
- when geography mouse hover:
- slot:
hoverinfo - event:
custom:popup
- slot:
  <div slot="hoverinfo" class="hoverinfo" style="text-align:center;">
    <!-- ... -->
  </div>
- when bubbles mouse hover:
- slot:
hoverBubbleInfo - event:
custom:popup-bubble
- slot:
  <div slot="hoverBubbleInfo" class="hoverinfo" style="text-align:center;">
    <!-- ... -->
  </div>
- when arc mouse hover:
- slot:
hoverArcInfo - event:
custom:popup-arc
- slot:
  <div slot="hoverArcInfo" class="hoverinfo" style="text-align:center;">
    <!-- ... -->
  </div>
when aws-region mouse hover
- slot:
hoverRegionInfo - event:
custom:popup-region
  <div slot="hoverRegionInfo" class="hoverinfo" style="text-align:center;">
    <!-- ... -->
  </div>
Inspired
- markmarkoh/datamaps - original
- btmills/react-datamaps - React-based datamaps library
- jsonmaur/aws-regions - AWS Regions and Availability Zones
Download details:
Author: Seungwoo321
Source: https://github.com/Seungwoo321/vue-datamaps
License:

1.10 GEEK