Basic
To enter into a debug mode you need to put at least 1 break point into your app code and after that you need to either run your code in debugger mode or attach a debugger with a running app on your emulator or device.
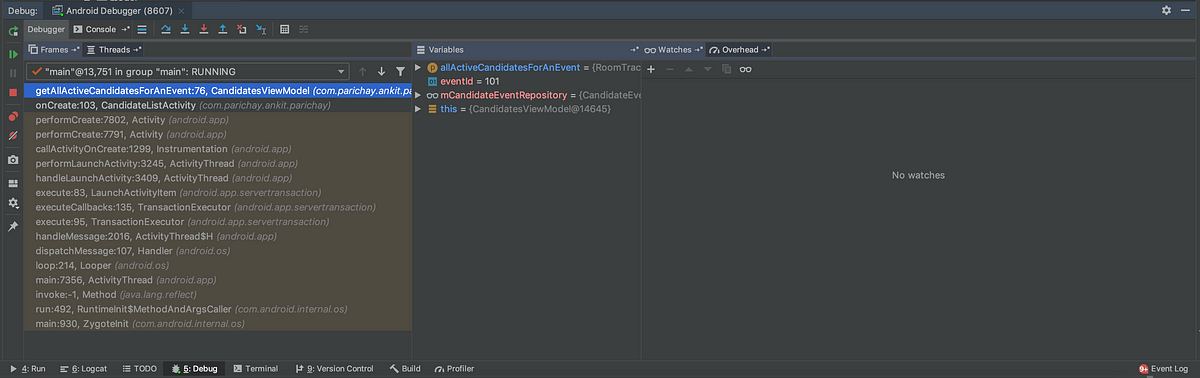
Once your app hit a breakpoint you will see a debugger window will popup like below

debugger mode
Basic commands include

Run over
- Run over:- go to next line of code.

Step into
- Step into :- go into a method/ function, (note:-_ it creates the arguments first.)_

Step out
- Step out:- come out of any method/function.

Run to cursor
- Run to cursor:- This might be a confusing one but it takes the execution to your cursor’s current position.

Show execution point
- Show execution point:- If you have moved somewhere in the code, this will take you to current execution point.
Advance
Let’s talk about some of the advance topics which will make your life easy and debugging will be fun.
- Inspect an object
- Evaluate Expression
- Change value of a variable
- Throw an exception forcefully from a method
Inspect an object
Using this you can see values of all class level variable inside any object.

Once you click on inspect a new popup will open like below which will give you entire information about the object like values of all class variable etc.

Inspect popup window
here you can change some of the variable values(in Kotlin if a variable is declared as val you can not change it’s value)

#android-app-development #kotlin #productivity #intellij #android-studio #android