Introduction
_In this blog, the Exploratory Data analysis for M5 competition data is performed using R and sales for 28 days were forecasted using Xgboost, Catboost, Lightgbm, and Facebook prophet. The best model is chosen by comparing the SMAPE error rate and _One standard error rule**.**
Background of Competition:
The Makridakis Competitions (also known as the M Competitions) are series of open competitions organized by teams led by forecasting researcher Spyros Makridakis and intended to evaluate and compare the accuracy of different forecasting methods. he first competition named M-Competition was held way back in 1982 with only 1001 data points, the complexity of model and data scale increased with every successive iteration.
Link to competition:https://www.kaggle.com/c/m5-forecasting-accuracy
Aim:
In March this year(2020), the fifth iteration named M5 competition was held. This m5 competition aims to forecast daily sales for the next 28 days i.e., till 22nd May 2016, and to make uncertainty estimates for these forecasts. In this blog, I am just going to do forecasting and uncertainty will be performed in my next blog with the best-chosen model.
Dataset:
The dataset provided contains 42,840 hierarchical sales data from Walmart. The dataset covers stores in three US states (California, Texas, and Wisconsin) and includes item level, department, product categories, and store details for 5 years starting from 29th Jan 2011 to 24th April 2016. Also, it has explanatory variables such as price, snap events, day of the week, and special events and festivals.
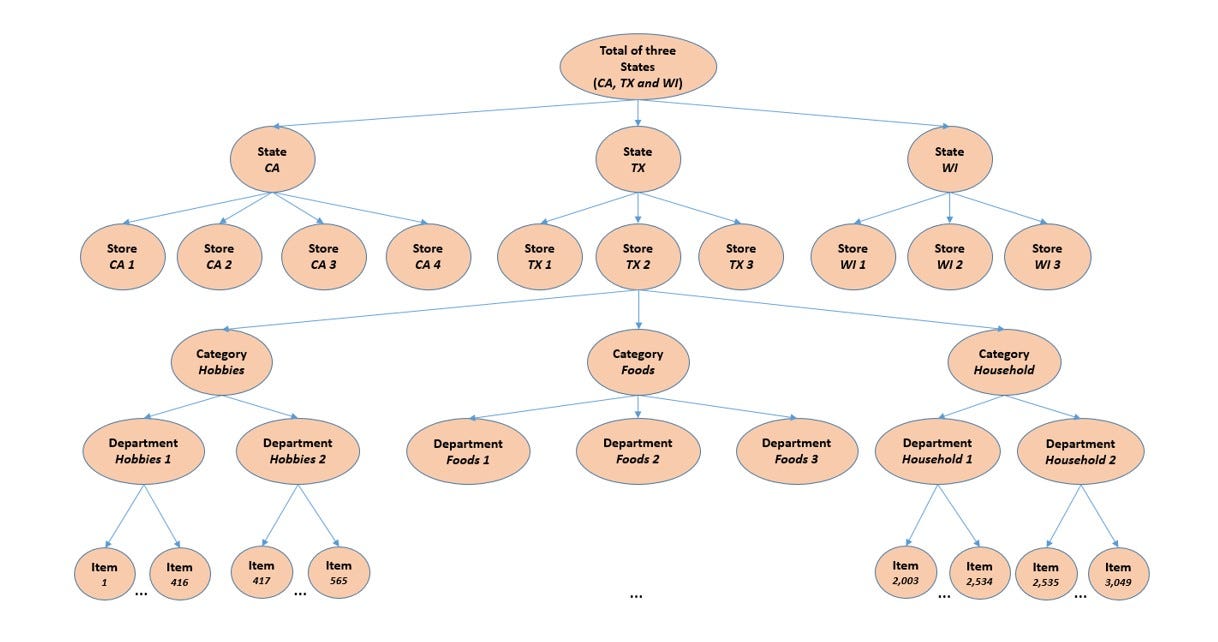
Figure 1: An overview of how the M5 series data is organized
The data comprises 3049 individual products from 3 categories and 7 departments, sold in 10 stores in 3 states. The hierarchical aggregation captures the combinations of these factors which makes it feasible to perform a bottom-up approach or top-down approach. For instance, we can create 1 time series for all sales or perform for each state separately and so on.
Hypothesis
Based on the data given some of the factors that may affect sales are:
- Day- Customers shopping time and spending mostly depends on the weekend. Many customers may like to shop only at weekends.
- **Special Events/Holidays: **Depending on the events and holidays customers purchasing behavior may change. For holidays like Easter, food sales may go up and for sporting events like Superbowl finals Household item sales may go up.
- **Product Price: **The sales are affected the most by the product price. Most customers will check the price tag before making the final purchase.
- **Product Category: **The type of product greatly affects sales. For instance, products in the household like TV will have fewer sales when compared with sales of food products.
- **Location: **The location also plays an important role in sales. In states like California, the customers might buy products they want irrespective of price, and customers in another region may be price sensitive.
Before diving deep into data exploration, A quick overview of population & Median Income for each state:
California
Population: 39.51 Million
Median Household Annual Income: $75,277
Texas
Population: 29 Million
Median Household Annual Income: $59,570
Wisconsin
Population 5.822 Million
Median Income: $60,733
The exploratory data analysis was done to test these hypothesis statements.
Exploratory Data Analysis
Let’s start data analysis by knowing which state recorded the highest sales and also the individual department sales in each of these three states.
#timeseries-forecasting #programming #m5-forecasting #data-science #data analysis