Simple Risk Management
You’re over halfway there to making more educated stock decisions! Welcome to part 4 of the financial analysis project. In this section, I’ll cover how to quantify stock performances over time and compare it with the risks for each investment. Understanding the relationship between risk and return is critical for making decisions that will work for you in the long run.
Returns Analysis
In part 3, we saw that most companys’ stock rose with the passage of time, but what I’m really interested in is understanding how much they rose by. Give me the numbers! Let’s quantify the returns of these companies by focusing on the closing prices and evaluating the percent change day-to-day. I can do this easily using pandas’ .pct_change() function.
In part 3, I created a dataframe called ‘closing_prices_df’ to store the daily closing prices for each stock. Now, let’s create a new dataframe to store the daily percent changes in closing prices. I call this the ‘returns’ dataframe.
## Create a new df called returns that calculates the return after each day.
returns = pd.DataFrame()

## We can use pandas pct_change() method on the 'Adj Close' column to create a column representing this return value.
for ticker in tickers:
    returns[ticker]=closing_prices_df[ticker].pct_change()*100
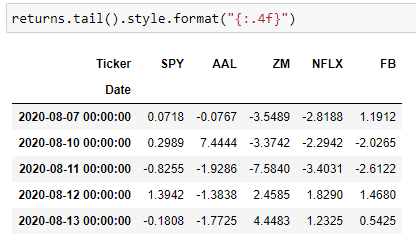
Figure 1: Tail of the returns dataframe to look at daily returns
Using the dataframe in Figure 1, we can now see how much gain/loss a stock experienced day by day. For example, AAL gained a whopping 7.44% on Aug. 10th but the following 3 consecutive days faced losses of 1.92%, 1.38%, and 1.77%. However, it’s difficult to see the big picture when looking at all these numbers.
Let’s summarize the data and look at the average daily returns. The average returns is the expected value of an investment’s change over time. As an investor, you want to know what to expect from your investments. We can do this simply by using the .mean() function.
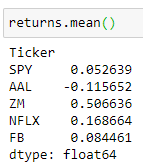
Figure 2. Average returns for each company
In Figure 2, we are looking at the average returns over ~2.5 years. In other words, if you invested in Facebook 2.5 years ago, you can expect the value of your investments to have grown 0.08% each day.
However, you should be careful when looking at aggregate functions like mean for incomplete data sets. Looking at Figure 2, Zoom’s average daily returns is 0.5%, the highest of the 5 companies. Remember from part 2 of this project, we are missing half of the data from Zoom. In other words, the explosive growth was not the average of the past 2.5 years, but instead for about half of that time.
And finally, AAL’s expected return is negative. Needless to say, we should strive to avoid investments that make you lose money! Even before the Coronavirus, American Airline’s stock was already dropping. Of course, COVID accelerated its decline.
#stocks #python #financial-analysis #beginners-guide #coding