An unsettling yet likely familiar situation: you deployed Airflow successfully, but find yourself constantly refreshing the webserver UI to make sure everything is running smoothly.
You rely on certain alerting tasks to execute upon upstream failures, but if the queue is full and tasks are stalling, how will you be notified?
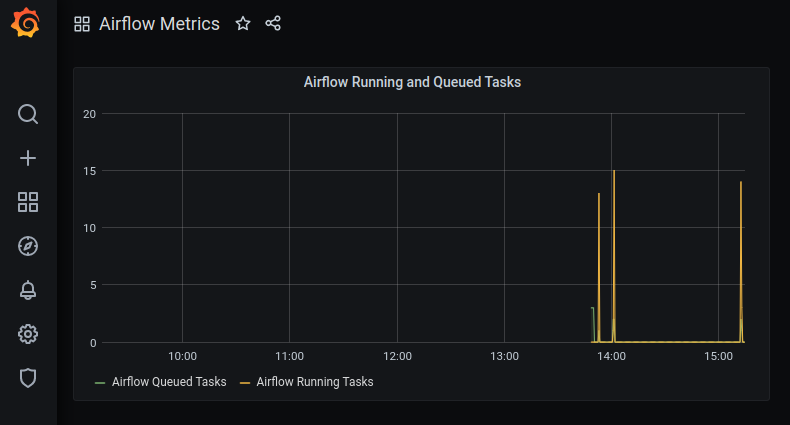
One solution: deploying Grafana, an open source reporting service, on top of Airflow.
Photo by Markus Spiske on Unsplash
The Proposed Architecture

Image by Author
To start, I’ll assume basic understanding of Airflow functionality and containerization using Docker and Docker Compose. More resources can be found here for Airflow, here for Docker, and here for Docker Compose.
Reference the code to follow along: https://github.com/sarahmk125/airflow-docker-metrics
Now, the fun stuff.
Used Services
To get Airflow metrics into a visually appealing dashboard that supports alerting, the following services are spun up in Docker containers declared in the docker-compose.yml file:
- **Airflow: **Airflow runs tasks within DAGs, defined in Python files stored in the
./dags/folder. One sample DAG declaration file is already there. Multiple containers are run, with particular nuances accounting for using the officialapache/airflowimage. More on that later. - StatsD-Exporter: The StatsD-Exporter container converts Airflow’s metrics in StatsD format to Prometheus format, the datasource for the reporting layer (Grafana). More information on StatsD-Exporter found here. The container definition includes the command to be executed upon startup, defining how to use the ports exposed.
statsd-exporter:
  image: prom/statsd-exporter
  container_name: airflow-statsd-exporter
  command: "--statsd.listen-udp=:8125 --web.listen-address=:9102"
  ports:
    - 9123:9102
    - 8125:8125/udp
- Prometheus: Prometheus is a service commonly used for time-series data reporting. It is particularly convenient when using Grafana as a reporting UI since Prometheus is a supported datasource. More information on Prometheus found here. The volumes mounted in the container definition indicate how the data flows to/from Prometheus.
prometheus:
  image: prom/prometheus
  container_name: airflow-prometheus
  user: "0"
  ports:
    - 9090:9090
  volumes:
    - ./prometheus/prometheus.yml:/etc/prometheus/prometheus.yml
    - ./prometheus/volume:/prometheus
- Grafana: Grafana is a reporting UI service that is often used to connect to non-relational databases. In the code described, Grafana uses Prometheus as a datasource for dashboards. The container definition includes an admin user for the portal, as well as the volumes defining datasources and dashboards that are already pre-configured.
grafana:
  image: grafana/grafana:7.1.5
  container_name: airflow-grafana
  environment:
    GF_SECURITY_ADMIN_USER: admin
    GF_SECURITY_ADMIN_PASSWORD: password
    GF_PATHS_PROVISIONING: /grafana/provisioning
  ports:
    - 3000:3000
  volumes:
    - ./grafana/volume/data:/grafana
    - ./grafana/volume/datasources:/grafana/datasources
    - ./grafana/volume/dashboards:/grafana/dashboards
    - ./grafana/volume/provisioning:/grafana/provisioning
#grafana #devops #airflow #docker #data-engineering