Not so long ago, a landmark event has happened: PVS-Studio appeared in Compiler Explorer! Now you can quickly and easily analyze the code for errors right on the godbolt.org site (Compiler Explorer). This feature opens up a large number of new possibilities – from quenching curiosity about the analyzer’s abilities to being able to quickly share check results with a friend. This article will cover the topic on how to use these features. Caution – GIFs!

If you want to get right to the point and analyze the code here and now, here is a fully ready-to-use link. I recommend adding it to your favourites – it will come in handy ;)
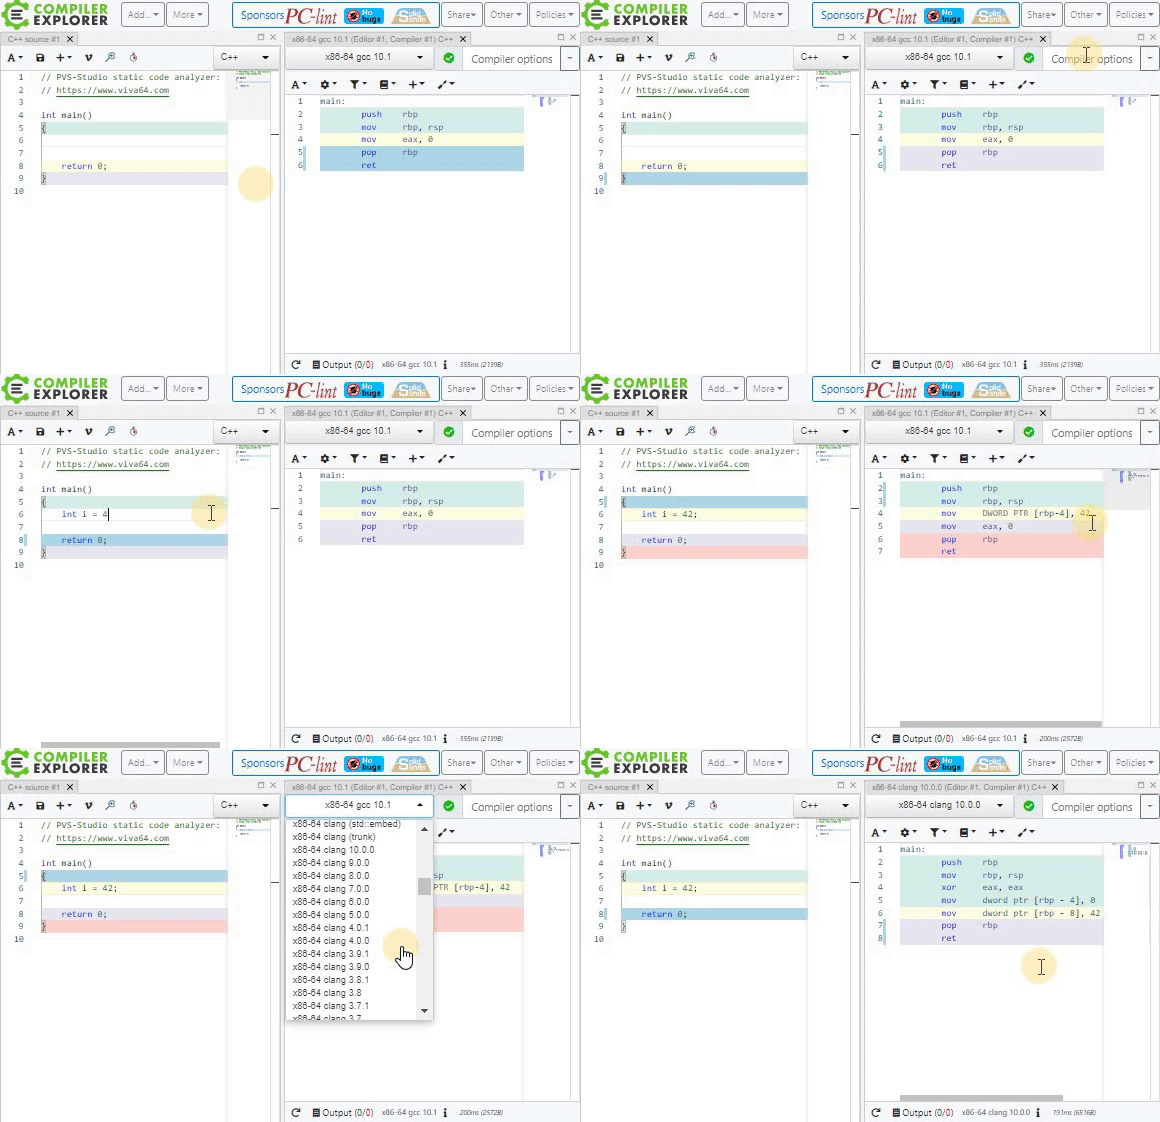
But first things first. Compiler Explorer is an interactive online service for researching compilers. Here you can write code directly on the site and immediately see what assembly output a particular compiler will generate for it:

In addition, the site has a whole set of features. Today we will consider the analysis using PVS-Studio. In order to perform the analysis, you need to do the following:
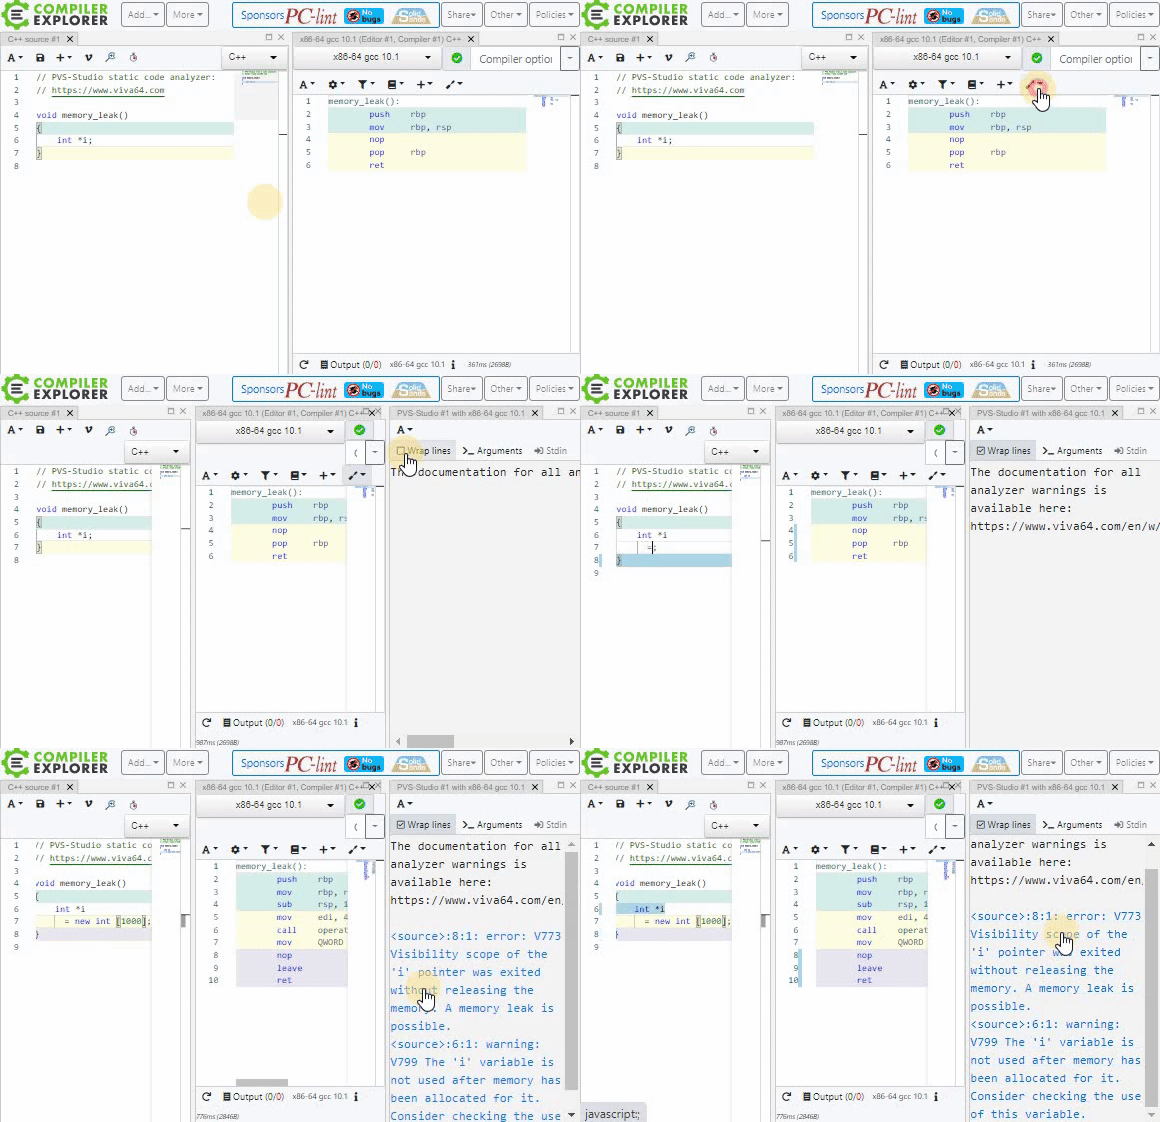
- Go to the site godbolt.org,
- In the tab with the compiler output, click “Add tool…”,
- Select “PVS-Studio” from the drop-down list.
You can see an example of this sequence of actions in the animation below:

Done! Now the window that appears will automatically display all the warnings that the analyzer issues to your code. You can analyze both manually written code and the source files that you upload separately. Obviously, the files must be self-contained and mustn’t use include on files that aren’t included in the standard library. Otherwise, the file can’t be compiled or checked.
Currently, analysis using PVS-Studio is available on the site for all versions of GCC and Clang for x86 and x64 platforms. We plan to expand the site’s capabilities to other compilers that we support (for example, MSVC or compilers for ARM), if there is demand for this.
Currently, only general diagnostics of the error, warning, and note levels are enabled on the site. We intentionally didn’t include other modes (Optimization, 64-bit, Custom, and MISRA), so that only the most important warnings remain in the output. Also, unlike PVS-Studio itself, Compiler Explorer doesn’t support C## and Java yet. We plan to support code analysis in these languages as soon as they appear there :)
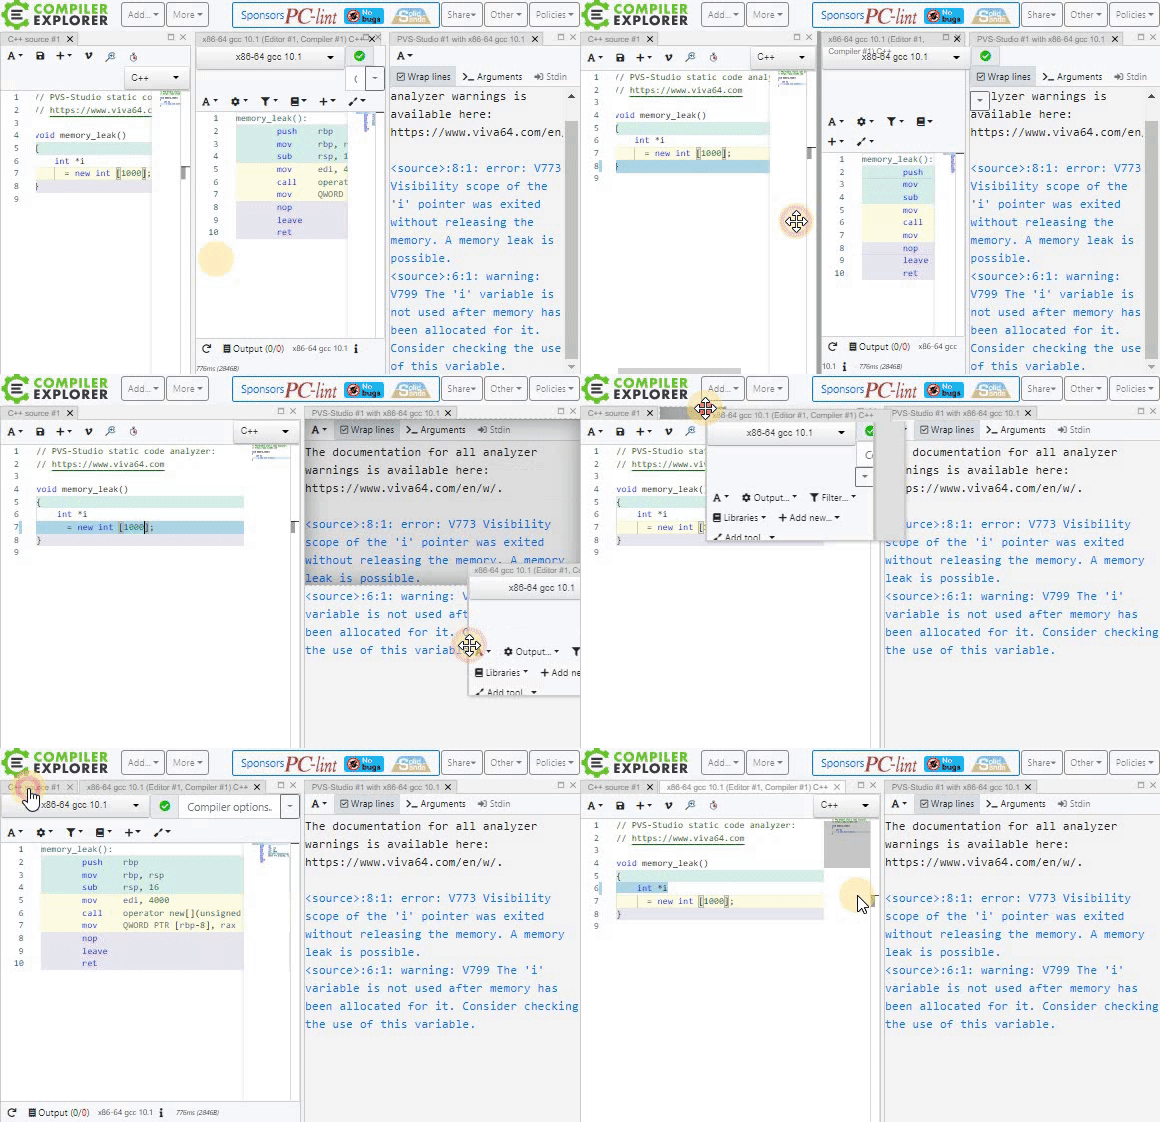
Compiler Explorer has a very smart window system, so you can move them or, for example, overlap them. If you aren’t interested in the compiler output right now, you can hide it in the following way:

#code #visual studio #visual studio code
