Monitoring is a crucial aspect of any Ops pipeline and for Kubernetes. Let’s deploy a Production grade Prometheus base monitoring system in less than 5 minutes.
Monitoring is a crucial aspect of any Ops pipeline and for technologies like Kubernetes which is a rage right now, a robust monitoring setup can bolster your confidence to migrate production workloads from VMs to Containers.
Today we will deploy a Production grade Prometheus based monitoring system, in less than 5 minutes.
Pre-Requisites:
- Running a Kubernetes cluster with at least 6 cores and 8 GB of available memory. I will be using a 6 node GKE for this tutorial.
- Working knowledge of Kubernetes Deployments and Services.
Setup:
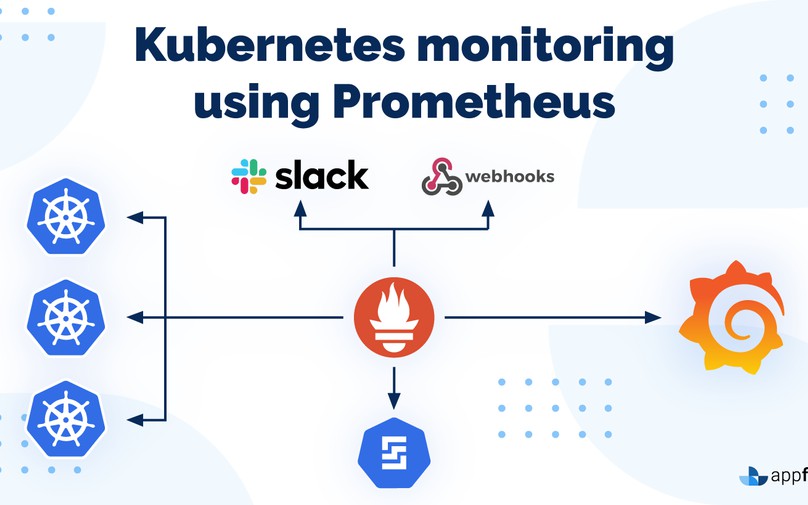
- Prometheus server with persistent volume. This will be our metric storage (TSDB).
- Alertmanager server which will trigger alerts to Slack/Hipchat and/or Pagerduty/Victorops etc.
- Kube-state-metrics server to expose container and pod metrics other than those exposed by cadvisor on the nodes.
- Grafana server to create dashboards based on Prometheus data.
_Note: All the manifests being used are present in this _Github Repo. I recommend cloning it before you start.
PS: Leave a star if you like it.
Monitoring Setup Overview
Deploying Alertmanager
Before deploying, please update “<your_slack_hook>” , “<your_victorops_hook>” , _‘<YOUR_API_KEY>’ _. If you use a notification channel other than these, please follow thisdocumentationand update the config
kubectl apply -f k8s/monitoring/alertmanager/
This will create the following:
- A monitoring namespace.
- Config-map to be used by alertmanager to manage channels for alerting.
- Alertmanager deployment with 1 replica running.
- Service with Google Internal Loadbalancer IP which can be accessed from the VPC (using VPN)
Shell
root$ kubectl get pods -l app=alertmanager2
NAME                            READY     STATUS    RESTARTS   AGE3
alertmanager-42s7s25467-b2vqb   1/1       Running   0          2m4
root$ kubectl get svc -l name=alertmanager5
NAME           TYPE           CLUSTER-IP    EXTERNAL-IP   PORT(S)          AGE6
alertmanager   LoadBalancer   10.12.8.110   10.0.0.6     9093:32634/TCP   2m7
root$ kubectl get configmap8
NAME                     DATA      AGE9
alertmanager             1         2m
In your browser, navigate to http://:9093 and you should see the alertmanager console.
#tutorial #kubernetes #cloud native #prometheus