Nowadays, the ability to work quickly and efficiently with large amounts of data has become a priority for the business world. Companies of different sizes and industry sectors actively apply various data visualization tools such as charts and diagrams in their projects to present complex data to the public in an informative and visually compelling way. Such tools are commonly implemented by developers in websites or web apps with the help of various open-source or commercial JavaScript libraries complemented with numerous helpful features.
But the thing is that not so many JS diagramming libraries offer online diagram editing tools, or simply Diagram Editors. Diagram editors allow end-users to promptly create different types of diagrams from scratch and edit them on the fly without coding. It is extremely important for businesses that work with frequently changing data. In this article, we will consider the pros and cons of four diagram editors that come with JavaScript libraries, take a closer look at their functional capabilities, and see how they benefit web developers and end-users.
DHTMLX Live Diagram Editors
DHTMLX Diagram is a JavaScript diagramming library for presenting data in the form of well-structured and easily configurable diagrams. It has two live editors, which can be customized and embedded into web apps: Org Chart Editor and Diagram Editor.

The user interface of DHTMLX diagram editors looks modern and user-friendly. It includes the following sections: toolbar with buttons, grid area, left panel, and right panel.
DHTMLX Diagram editors enable end-users to create diagrams and org charts (or diagrams mixed with org charts) with the help of predefined shapes (30+ types of flowchart and org chart shapes) and fine-tune their appearance using side panels.
If you need to create a diagram with other types of shapes, you need to add them to the editor via code. DHTMLX offers special HTML templates, which make it easy to create any shape even for beginners at JavaScript.
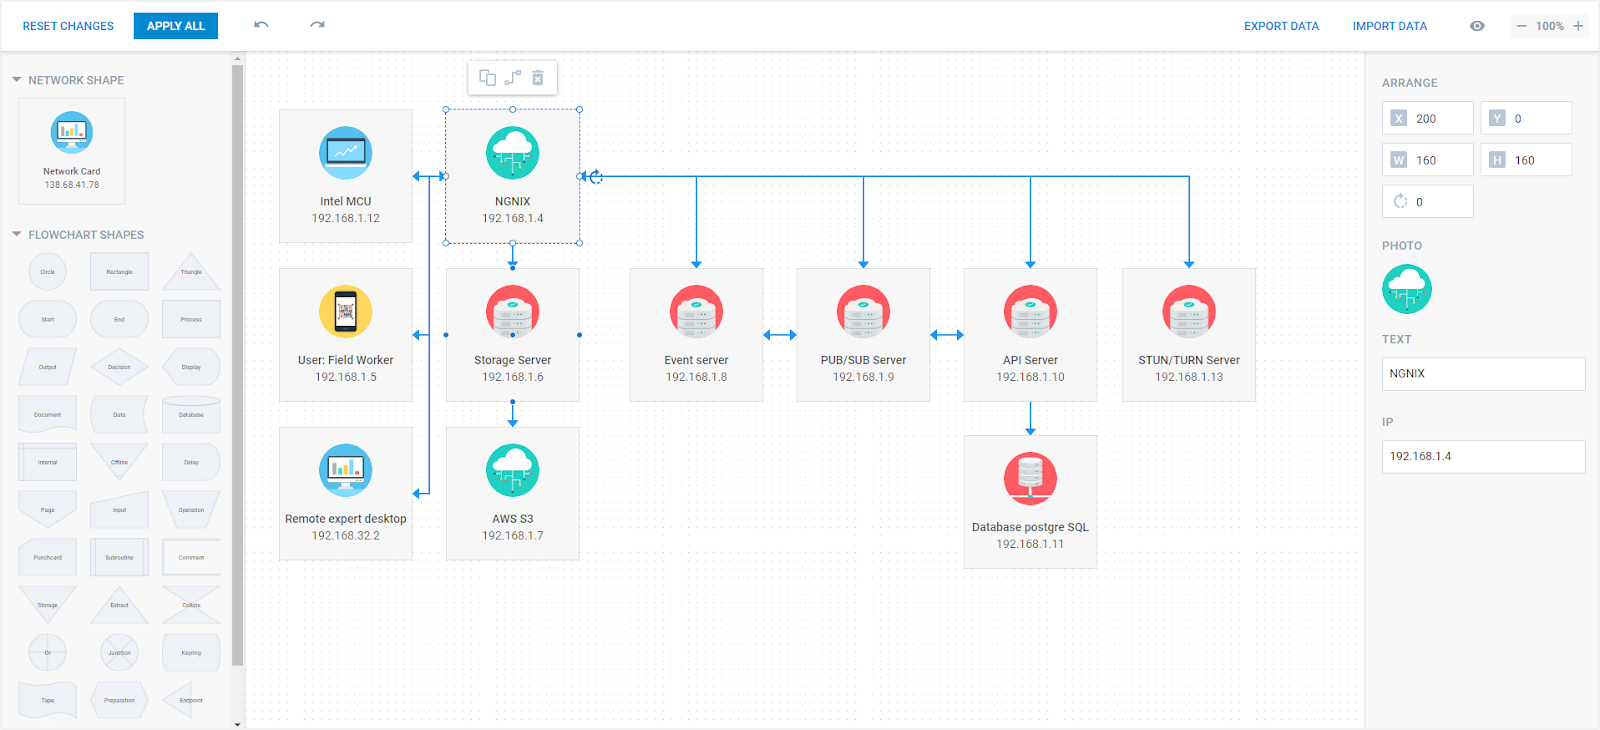
On the left panel, you can find all shapes, including custom ones, that can be simply dragged to the editor’s grid area, placed on the desired positions, and linked with each other via connectors.
In the grid area, it is possible to resizeand rotate each selected shape as well as perform several editing operations on a particular shape via its toolbar. It is also possible to simultaneously perform basic operations (copy, paste, delete, etc.) on several shapes using the multiselection feature.
The right panel contains fields for setting such diagram parameters as shape arrangement, color, size, stroke, and text attributes. So you can change the necessary settings and give selected shapes of the diagram a new look. Web developers can also add new sidebar options for styling custom shapes - for example, a file uploader to add an image to a shape.
To make the whole process of the diagram building faster the Diagram Editor provides an auto-layout algorithm. This smart technology helps to instantly arrange any number of randomly placed shapes in a well-organized diagram by clicking on the “auto layout” button.
#javascript #web development #dhtmlx #programming